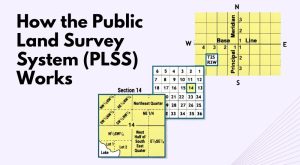
How the Public Land Survey System (PLSS) Works
Learn how the Public Land Survey System (PLSS) works, which divides land in the United States into townships, ranges, and sections.
Learn how the Public Land Survey System (PLSS) works, which divides land in the United States into townships, ranges, and sections.
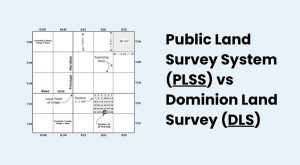
The Dominion Land Survey (DLS) and the Public Land Survey System (PLSS) divide the land to help distribute land and assign land titles.
Map symbology is the symbols, colors, lines, and visual elements on a map. These symbols communicate details about the physical world.

3D mapping is the process of capturing three-dimensional information about the terrain or environment around you to represent the real world.
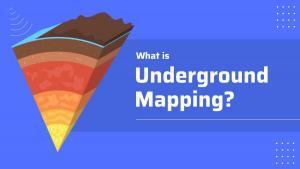
Underground mapping uses a variety of imaging technologies to map subsurface information including oil and gas exploration and utilities.
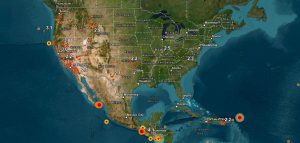
Today, we’re going to provide you with a list of earthquake maps to help improve disaster response, recovery efforts, and risk assessment.
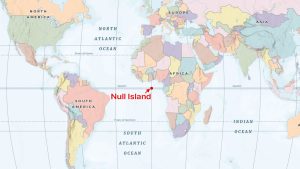
Null Island is an inside joke in the world of GIS. It’s actually a place that doesn’t exist in the world today but where data lands in error.

Trying to spot a UFO? Our list of 7 UFO sighting maps allows you to explore extraterrestrial encounters with unique cosmic cartography.
These seven drought maps capture water availability across regions and can aid in proactive planning to combat the drought’s effects.
Understanding map scale is important for you as a map user and for anyone who wants to make sense of maps. Learn about this essential concept.