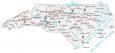
North Carolina County Map

About the map
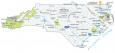
This North Carolina county map displays its 100 counties. If you count each state’s tally of counties, North Carolina ranks 8th highest. Only Texas, Georgia, Virginia, Kentucky, Missouri, Kansas, and Illinois have more counties than North Carolina.
Conversely, the counties with the lowest populations are Tyrrell County and Hyde County. Both are under 5,000 people. The islands in the Pamlico Sound primarily belong to Dare County. This county also consists of the Alligator River National Wildlife Refuge along the eastern shore of North Carolina.
Wake County is the most populated county in North Carolina with over 1,100,000 residents. This county is home to the state capital, Raleigh. But Mecklenburg County is a close second and is home to an estimated 1,110,000 people.
You are free to use our county map of North Carolina for educational and commercial uses. Attribution is required. How to attribute?
North Carolina County List
| FIPS Code | Name | Land (sq mi) | Water (sq mi) | Population (2024) |
|---|---|---|---|---|
| 37-001 | Alamance County | 423.4 | 10.8 | 183,040 |
| 37-003 | Alexander County | 260.0 | 3.6 | 36,693 |
| 37-005 | Alleghany County | 234.4 | 1.4 | 11,379 |
| 37-007 | Anson County | 531.5 | 5.6 | 22,432 |
| 37-009 | Ashe County | 425.1 | 3.1 | 27,266 |
| 37-011 | Avery County | 247.3 | 0.2 | 17,811 |
| 37-013 | Beaufort County | 832.0 | 130.9 | 44,576 |
| 37-015 | Bertie County | 699.2 | 42.1 | 16,939 |
| 37-017 | Bladen County | 874.9 | 12.7 | 29,777 |
| 37-019 | Brunswick County | 849.2 | 200.4 | 167,112 |
| 37-021 | Buncombe County | 656.5 | 3.5 | 279,210 |
| 37-023 | Burke County | 506.2 | 8.0 | 88,545 |
| 37-025 | Cabarrus County | 361.2 | 2.7 | 244,925 |
| 37-027 | Caldwell County | 471.9 | 2.7 | 80,739 |
| 37-029 | Camden County | 240.3 | 69.9 | 11,184 |
| 37-031 | Carteret County | 507.6 | 822.8 | 70,259 |
| 37-033 | Caswell County | 425.4 | 3.3 | 22,363 |
| 37-035 | Catawba County | 401.4 | 14.7 | 167,054 |
| 37-037 | Chatham County | 681.7 | 27.3 | 83,874 |
| 37-039 | Cherokee County | 455.5 | 11.1 | 30,373 |
| 37-041 | Chowan County | 172.7 | 61.0 | 13,891 |
| 37-043 | Clay County | 215.0 | 5.8 | 12,042 |
| 37-045 | Cleveland County | 464.2 | 3.9 | 102,194 |
| 37-047 | Columbus County | 938.1 | 16.9 | 50,054 |
| 37-049 | Craven County | 706.6 | 66.7 | 104,167 |
| 37-051 | Cumberland County | 652.6 | 5.9 | 338,430 |
| 37-053 | Currituck County | 261.9 | 264.5 | 32,278 |
| 37-055 | Dare County | 383.2 | 1158.5 | 38,183 |
| 37-057 | Davidson County | 553.2 | 14.5 | 177,809 |
| 37-059 | Davie County | 263.7 | 2.9 | 45,383 |
| 37-061 | Duplin County | 814.7 | 5.5 | 50,539 |
| 37-063 | Durham County | 286.5 | 11.4 | 343,628 |
| 37-065 | Edgecombe County | 505.4 | 1.4 | 49,124 |
| 37-067 | Forsyth County | 407.8 | 4.5 | 398,143 |
| 37-069 | Franklin County | 491.8 | 2.8 | 79,771 |
| 37-071 | Gaston County | 355.7 | 8.0 | 242,010 |
| 37-073 | Gates County | 340.6 | 5.1 | 10,299 |
| 37-075 | Graham County | 292.0 | 9.7 | 8,179 |
| 37-077 | Granville County | 532.0 | 5.6 | 61,544 |
| 37-079 | Greene County | 266.7 | 0.5 | 20,671 |
| 37-081 | Guilford County | 645.9 | 11.7 | 558,816 |
| 37-083 | Halifax County | 723.7 | 6.5 | 46,992 |
| 37-085 | Harnett County | 595.0 | 6.3 | 146,096 |
| 37-087 | Haywood County | 553.6 | 0.9 | 63,048 |
| 37-089 | Henderson County | 372.9 | 2.1 | 120,771 |
| 37-091 | Hertford County | 353.2 | 7.2 | 19,169 |
| 37-093 | Hoke County | 390.1 | 1.5 | 55,382 |
| 37-095 | Hyde County | 612.3 | 846.7 | 4,583 |
| 37-097 | Iredell County | 574.2 | 23.2 | 206,361 |
| 37-099 | Jackson County | 491.2 | 3.8 | 45,281 |
| 37-101 | Johnston County | 791.2 | 4.5 | 249,794 |
| 37-103 | Jones County | 471.4 | 2.3 | 9,462 |
| 37-105 | Lee County | 255.1 | 4.1 | 68,537 |
| 37-107 | Lenoir County | 399.1 | 2.3 | 55,332 |
| 37-109 | Lincoln County | 295.8 | 9.0 | 97,611 |
| 37-111 | McDowell County | 440.0 | 5.4 | 45,269 |
| 37-113 | Macon County | 515.6 | 4.1 | 38,717 |
| 37-115 | Madison County | 449.6 | 1.9 | 22,352 |
| 37-117 | Martin County | 456.4 | 0.3 | 21,523 |
| 37-119 | Mecklenburg County | 523.6 | 22.5 | 1,206,285 |
| 37-121 | Mitchell County | 221.3 | 0.6 | 15,030 |
| 37-123 | Montgomery County | 491.5 | 10.0 | 26,364 |
| 37-125 | Moore County | 697.7 | 8.0 | 108,417 |
| 37-127 | Nash County | 540.4 | 2.4 | 97,990 |
| 37-129 | New Hanover County | 192.2 | 136.7 | 243,333 |
| 37-131 | Northampton County | 536.6 | 13.9 | 16,580 |
| 37-133 | Onslow County | 761.9 | 143.3 | 212,954 |
| 37-135 | Orange County | 397.5 | 3.4 | 152,877 |
| 37-137 | Pamlico County | 336.5 | 225.1 | 12,550 |
| 37-139 | Pasquotank County | 226.9 | 62.4 | 41,418 |
| 37-141 | Pender County | 871.3 | 62.9 | 70,077 |
| 37-143 | Perquimans County | 247.1 | 81.8 | 13,460 |
| 37-145 | Person County | 392.3 | 12.1 | 40,143 |
| 37-147 | Pitt County | 652.4 | 3.2 | 180,783 |
| 37-149 | Polk County | 237.7 | 0.8 | 20,320 |
| 37-151 | Randolph County | 782.3 | 7.6 | 148,389 |
| 37-153 | Richmond County | 473.7 | 6.0 | 41,990 |
| 37-155 | Robeson County | 947.3 | 2.0 | 118,624 |
| 37-157 | Rockingham County | 565.6 | 7.1 | 93,517 |
| 37-159 | Rowan County | 511.5 | 12.4 | 153,384 |
| 37-161 | Rutherford County | 565.4 | 1.8 | 65,587 |
| 37-163 | Sampson County | 945.7 | 1.9 | 60,404 |
| 37-165 | Scotland County | 319.1 | 1.5 | 33,898 |
| 37-167 | Stanly County | 395.1 | 9.7 | 67,326 |
| 37-169 | Stokes County | 449.0 | 6.8 | 45,857 |
| 37-171 | Surry County | 533.7 | 4.0 | 71,547 |
| 37-173 | Swain County | 527.7 | 12.5 | 13,945 |
| 37-175 | Transylvania County | 378.4 | 2.0 | 34,103 |
| 37-177 | Tyrrell County | 390.8 | 206.4 | 3,517 |
| 37-179 | Union County | 632.7 | 7.0 | 263,386 |
| 37-181 | Vance County | 252.4 | 16.3 | 42,337 |
| 37-183 | Wake County | 834.8 | 22.4 | 1,232,444 |
| 37-185 | Warren County | 429.1 | 15.2 | 19,081 |
| 37-187 | Washington County | 346.5 | 75.4 | 10,654 |
| 37-189 | Watauga County | 312.4 | 0.9 | 54,997 |
| 37-191 | Wayne County | 553.9 | 3.8 | 120,338 |
| 37-193 | Wilkes County | 754.5 | 2.6 | 66,186 |
| 37-195 | Wilson County | 367.6 | 5.5 | 79,958 |
| 37-197 | Yadkin County | 334.9 | 2.8 | 37,995 |
| 37-199 | Yancey County | 312.6 | 0.6 | 18,993 |