How to Track the Spread of Viruses Using GIS
Disease Tracking and Dashboards
Every day, communities are at risk of transmissible diseases. For example, COVID-19 may have been one of the most impactful diseases of our time.
But how do we keep track of the spread of viruses?
We use GIS and real-time dashboards to track viruses, diseases, and global pandemics. In fact, the whole field of GIS started by mapping a Cholera outbreak in London, England back in 1854.
So, let’s take a look at some examples of GIS in the field of epidemiology.
READ MORE: The Remarkable History of GIS
Coronavirus COVID-19 Map at Johns Hopkins University
One of the best examples of disease tracking is from the Coronavirus COVID-19 Dashboard by the Center for Systems Science and Engineering (CSSE) at Johns Hopkins University.
The COVID-19 virus began in Wuhan, China. Over time, it has quickly spread to other parts of the world. For example, the virus spread rapidly to Italy, South Korea, and the United States.
As global cases rose, COVID-19 became a global pandemic at the start of 2020. Throughout the COVID-19 pandemic, the most complete picture of the outbreak came from Johns Hopkins University built using the Esri Operational Dashboard.
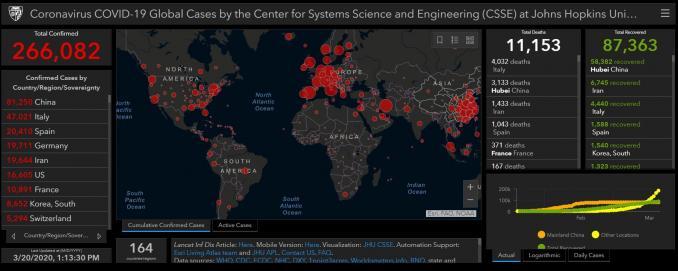
For example, it tracks the following:
- Total confirmed cases of Coronavirus COVID-19
- The number of total deaths and recovered from the virus
- A proportional symbol map with geographic centroids
This information became instrumental in providing real-time data and visualizations to track the spread and impact of the virus worldwide.
Real-time Disease Map from HealthMap
One of the most reliable sources for real-time disease information is HealthMap. HealthMap brings real-time information on an hourly basis from thousands of sources.
All this information and results are in a real-time disease map with over 90% accuracy. By using it, you can find out what health issues are happening where. Because you can see points as proportional symbols, you can better understand location patterns and the risk of spreading.
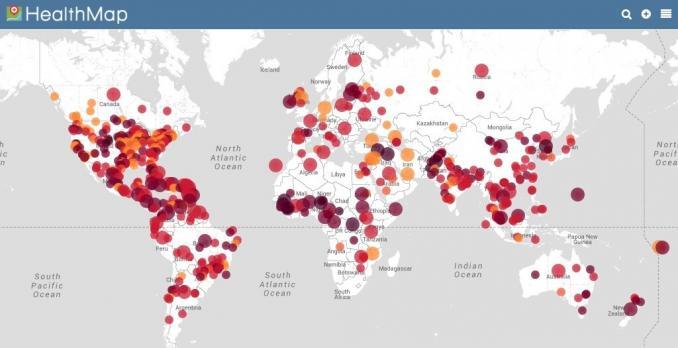
For example, you can collect:
- Disease type
- Location name
- Number of cases
Boston’s Children’s Hospital founded HealthMap in 2006. A team of software engineers, researchers, and epidemiologists developed it to map out global disease outbreaks.
Tracking Disease Outbreak
These real-time disease maps assist in recognizing the spread of epidemics.
They are accessible to travelers, citizens, and decision-makers with timely information.
This can help countries prepare just like how it helped us fight global pandemics like Coronavirus COVID-19.
Do you have any more sources to track the spread of viruses? Please let us know with a comment below.