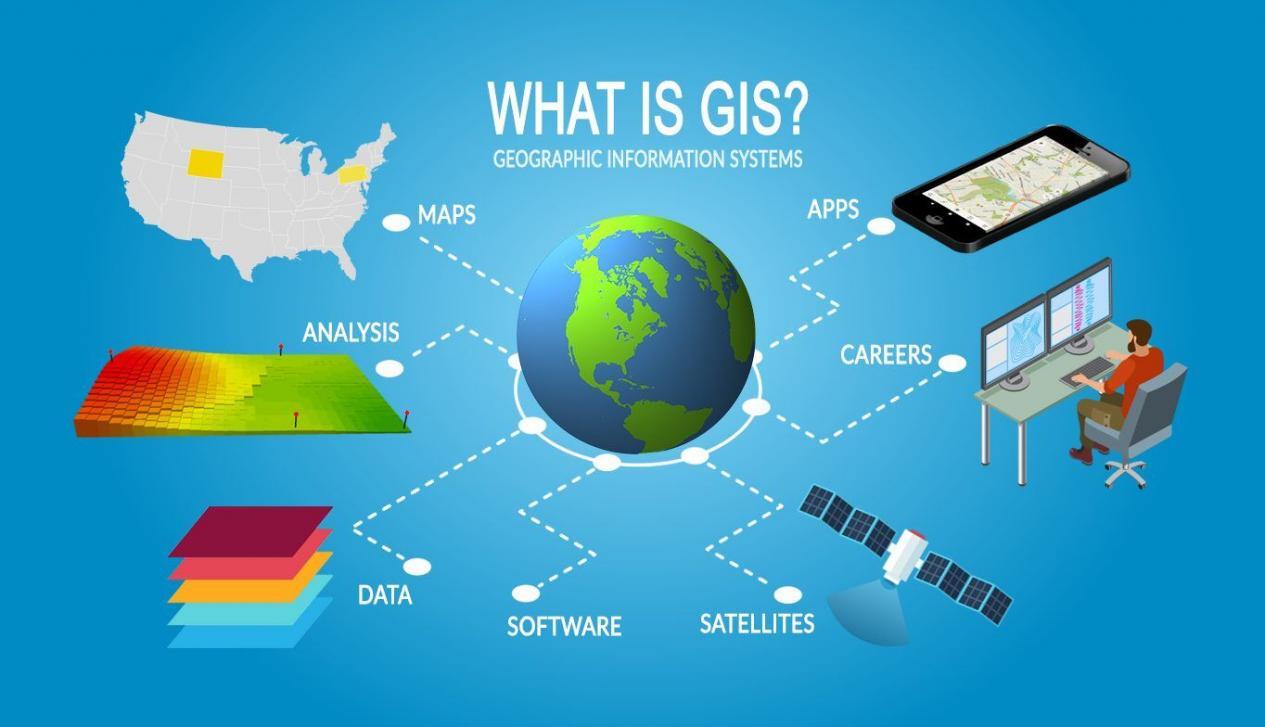
What is GIS? Geographic Information Systems
DEFINITION:
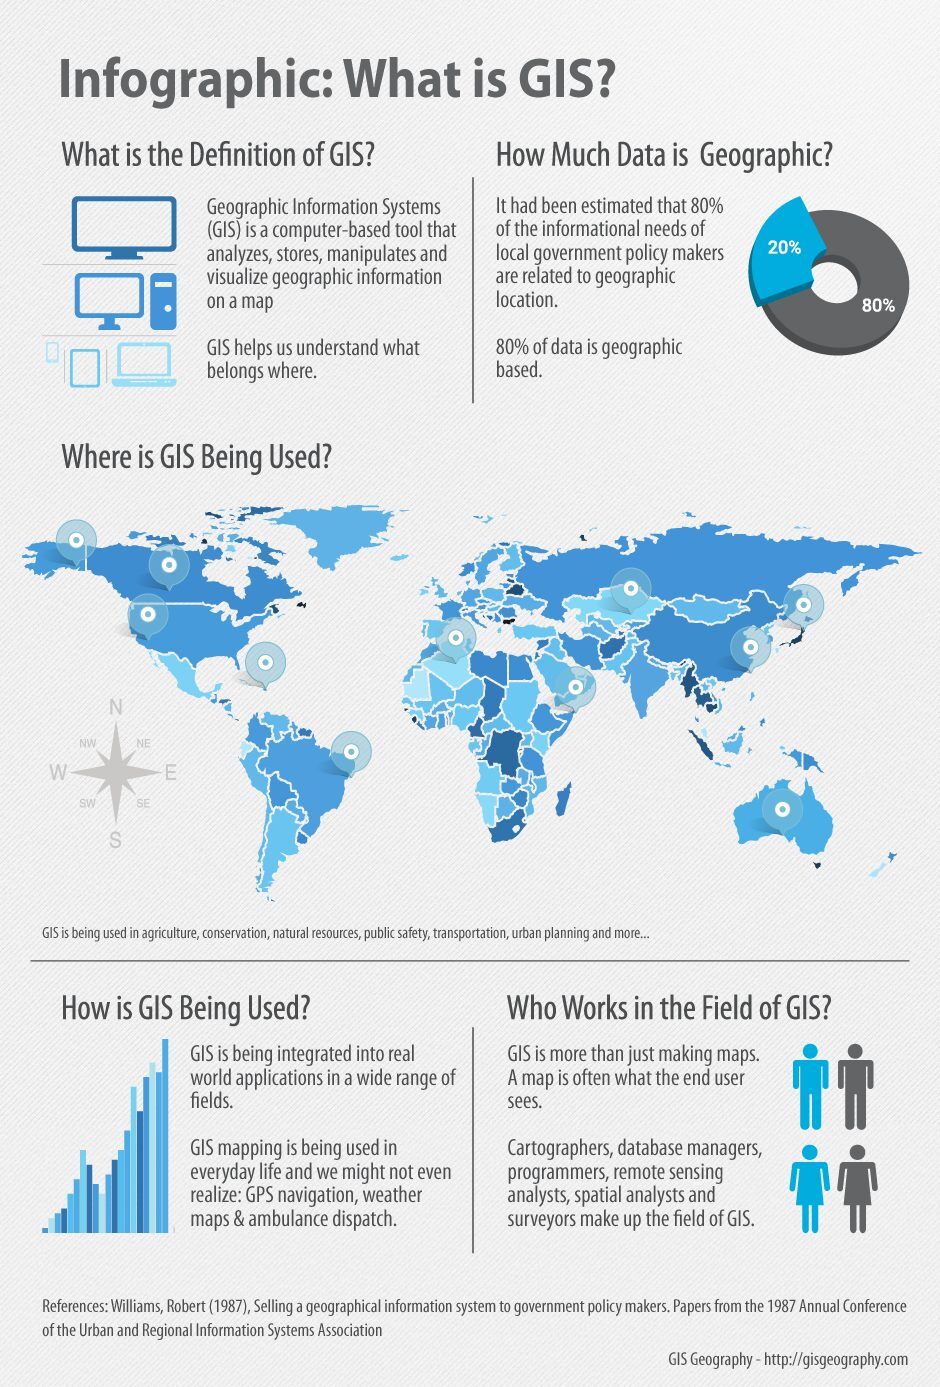
GIS (Geographic Information Systems) is a technology that collects, stores, analyzes, manages, and displays spatial or geographic data.
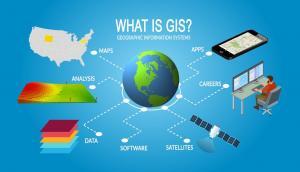
What is GIS?
GIS stands for Geographic Information Systems. A GIS stores, analyzes, and visualizes data for geographic positions on Earth’s surface.
It’s a computer-based tool that examines spatial relationships, patterns, and trends in geography.
GIS mapping produces visualizations of geospatial information. The 4 main ideas of Geographic Information Systems (GIS) are:
Because viewing and analyzing data on maps impacts our understanding of data, we can make better decisions using GIS.
It helps us understand what is where. The analysis becomes simple. Answers become clear.
Because you don’t fully understand your data until you see how it relates to other things in a geographic context.
Definitions of GIS
To get started, let’s explore some simple definitions of GIS.
A geographic information system (GIS) is a system that creates, manages, analyzes, and maps all types of data. GIS connects data to a map, integrating location data (where things are) with all types of descriptive information (what things are like there).
Environmental Systems Research Institute (Esri)
A Geographic Information System (GIS) is a computer system that analyzes and displays geographically referenced information. It uses data that is attached to a unique location.
United States Geological Survey (USGS)
A geographic information system (GIS) is a computer system for capturing, storing, checking, and displaying data related to positions on Earth’s surface.
NATIONAL GEOGRAPHIC
These definitions of GIS share several commonalities:
- Computer-Based System: All three definitions emphasize that GIS is a computer-based technology. This highlights the role of computers in processing and managing geographic information.
- Spatial Data: They all mention the importance of geographic or geographically referenced information. GIS means that it deals with data associated with specific locations on the Earth’s surface.
- Data Management: Each definition of GIS mentions the storage and management of data. GIS is not just about displaying maps; it involves capturing, managing, and analyzing data in a spatial context.
- Integration of Data and Maps: These definitions stress location data and descriptive information. GIS connects spatial data (where things are) with attribute data (what things are like there). This integration is a core aspect of GIS functionality.
- Analytical Capability: The terms “analyzes” and “displays” indicate that GIS is not just about visualizing data. But a GIS also includes analytical functions. This means it can analyze and create insights from spatial data.
What are the Use Cases of GIS?
Every day, GIS powers millions of decisions around the world. It makes a big impact on our lives and you might not even realize it. For example, we use GIS for:
These 1000 GIS applications show all the use cases of Geographic Information Systems.
READ MORE: The Power of Spatial Analysis: Patterns in Geography
How To Visualize Geography with Maps
I think you’ll agree:
It’s REALLY hard to visualize latitude and longitude coordinates from a spreadsheet.
| City | Latitude | Longitude |
|---|---|---|
| Seattle | 47.5° | -122.3° |
| New York | 40.7 | -73.9° |
| Miami | 25.8° | -80.2° |
| Los Angeles | 33.9° | -118.2° |
But when you add these positions on a map, suddenly spreadsheets come to life.
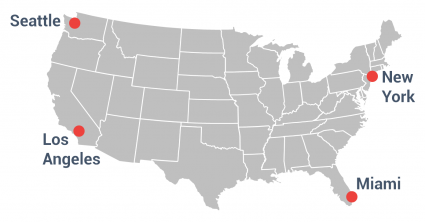
That’s because maps make geographic information easier to understand.
When you have geographic context, you don’t only see where they are on a map. But you can:
- Calculate how far points are from each other
- Check if points are clustered for patterns and trends
- Find the optimal route between cities
Components of Geographic Information Systems
The 3 main components of Geographic Information Systems are:
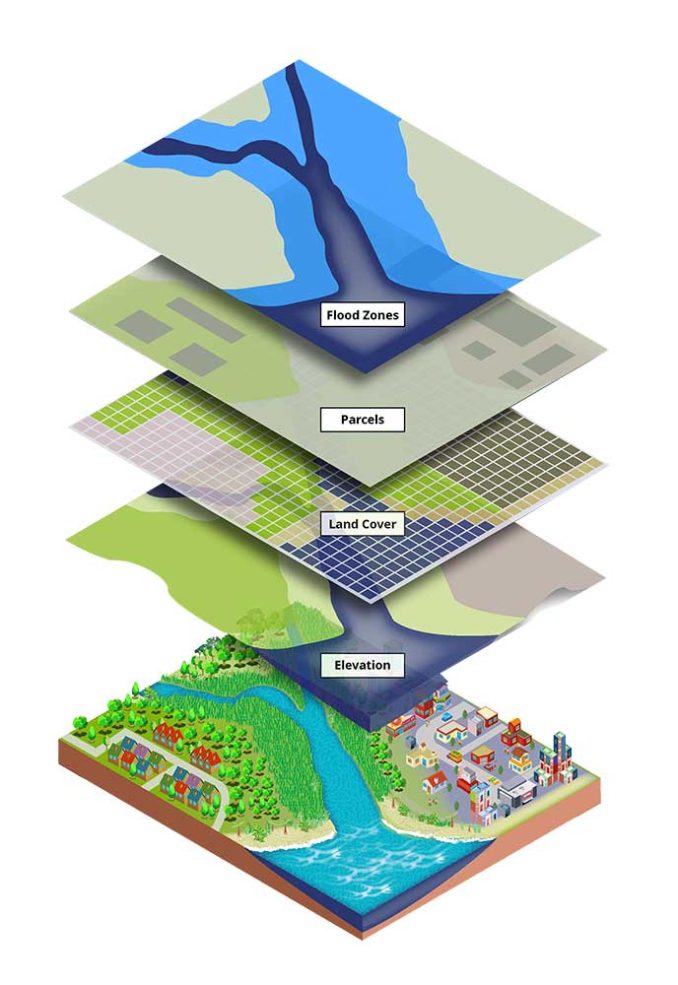
1. Data
GIS stores location data as thematic layers. Each data set has an attribute table that stores information about the feature. The two main types of GIS data are raster and vector:
Raster
Raster data look like grids because they store data in rows and columns. They can be discrete or continuous. For example, we often represent land cover, temperature data, and imagery as raster data.
Vector
Vectors are points, lines, and polygons with vertices. For example, fire hydrants, contours, and administrative boundaries are often vectors.
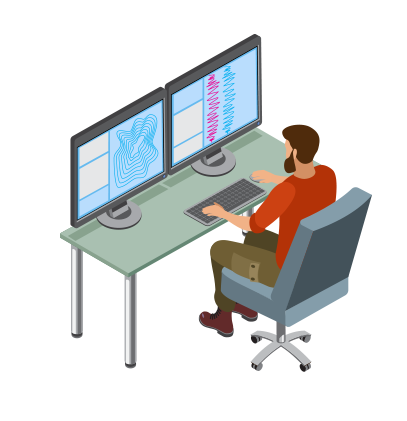
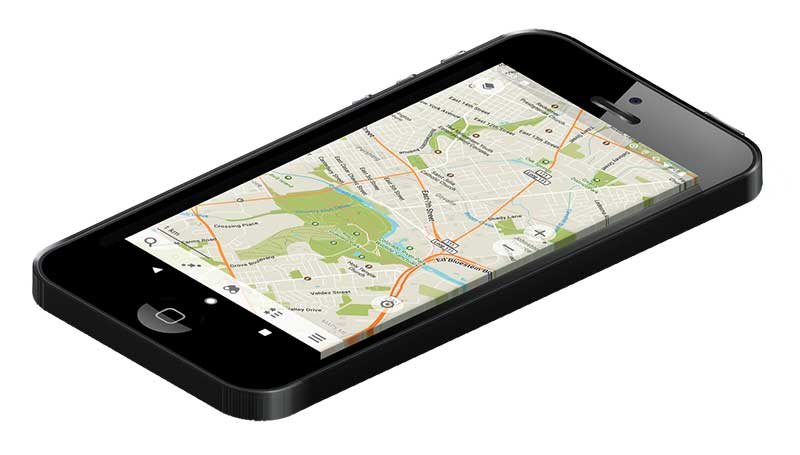
2. Hardware
Hardware runs GIS software. It could be anything from powerful servers, mobile phones, or a personal GIS workstation. The CPU is your workhorse and data processing is the name of the game. Dual monitors, extra storage, and crisp graphic processing cards are must-haves too in GIS.
3. Software
ArcGIS and QGIS are the leaders in GIS software. GIS software specializes in spatial analysis by using math in maps. It blends geography with modern technology to measure, quantify, and understand our world.
Drive Decisions with Spatial Analysis
Never before have we had more pressing issues in need of a geospatial perspective. For example, climate change, natural disasters, and population are all geographic in nature. These global issues need location-based knowledge that can only come from a GIS.
Most people think GIS is only about “making maps”. But we harness the power of GIS because of the insights of spatial analysis. We use spatial analysis through math in maps. Spatial analysis is difficult with paper maps so that’s why we need GIS. Here are examples of spatial analysis:
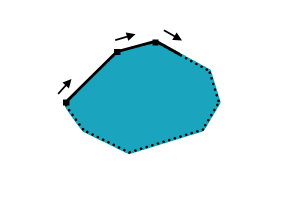
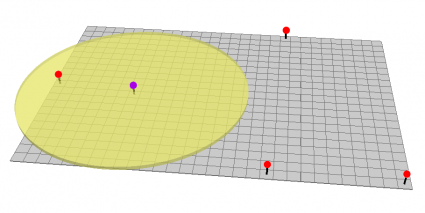
Buffer
The buffer tool generates a polygon around features at a set distance. By creating buffers, you can find the surrounding features that are within buffers.
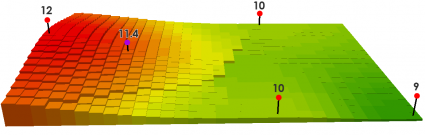
Hot Spot
Hot spots highlight areas that have clusters of points. Whereas cold spots have a small density of points.
Build Your Career in Geomatics
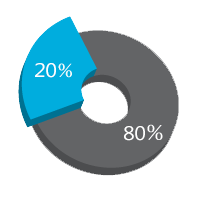
This quote means that if you take 80% of all government data, 80% has a geographic context. This quote originated from Robert Williams in his paper “Selling a Geographical Information System to government policymakers.”[1]
But recently, researchers have cut this percentage to 60% in 2012.[2] Either way, geography is a big component of data.
From planning a pipeline to navigating ships, spatial problems need spatial thinkers. This is why Geographic Information Systems has expanded into countless disciplines. GIS careers are booming for:
- CARTOGRAPHERS create maps. In fact, the origin of “cartographer” comes from charta which means “tablet or leaf of paper” and graph “to draw”
- DATABASE MANAGERS store and extract information from structured sets into spatial databases.
- PROGRAMMERS write code and automate redundant GIS processes. For example, GIS programming languages include Python, SQL, C++, Visual Basic, and JavaScript.
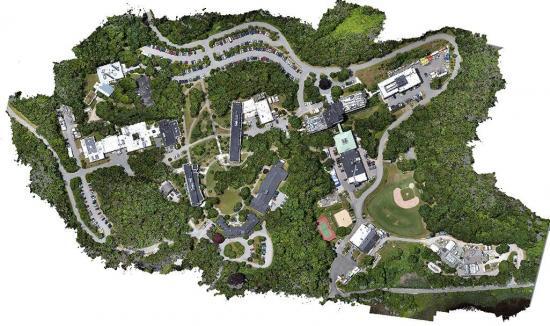
- REMOTE SENSING SPECIALISTS use aerial, satellite imagery, and remote sensing software.
- SPATIAL ANALYSTS use geoprocessing tools to manipulate, extract, locate, and analyze geographic data.
- LAND SURVEYORS measure the 3-dimensional coordinates on the land.
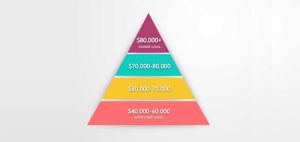
READ MORE: GIS Salary Expectations: Climb the GIS Career Ladder
80% of the informational needs of local government are related to geographic location.
GIS All Started by Mapping Cholera
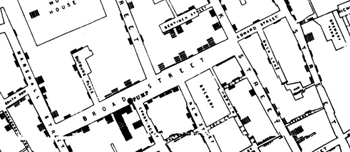
In 1854, cholera hit the city of London, England. No one knew where the disease started. So, British physician John Snow started mapping the outbreak.
It wasn’t just the disease. But he also mapped out roads, property boundaries, and water lines.
When he added these features to a map, something interesting happened. He noticed that cholera cases were only along one water line. This was a breakthrough that connected geography to public health safety. But it wasn’t only the beginning of spatial analysis. It also marked the start of epidemiology, the study of the spread of disease.
In 1968, a man by the name of Roger Tomlinson started piecing together modern computing with maps. In fact, he first coined the term “GIS” in his paper “A Geographic Information System for Regional Planning“.[3] At this moment, GIS truly became a computer-based tool for storing map data. In 2014, Roger Tomlinson later passed away and will always be remembered as the “father of GIS”.
READ MORE: The Remarkable History of GIS

“Great discoveries and improvements invariably involve the cooperation of many minds. I may be given credit for having blaze the trail of GIS. But when I look at the subsequent development, I feel the credit is due to others rather than just myself.”
— Roger Tomlinson, The Father of GIS
GIS Uses and Applications
Geographic Information Systems is jam-packed with example use cases. For example, we’ve found over 1000 GIS uses and applications. Here are some examples below.
ENVIRONMENT: By far, the heaviest users are for the environment. For example, conservationists use GIS for climate change, groundwater studies, and impact assessments.
MILITARY AND DEFENSE: The military is a heavy user of GIS. They use it for location intelligence, logistics management, and spy satellites.
AGRICULTURE: Farmers use it for precision farming, soil mapping, and crop productivity.
FORESTRY: Foresters manage timber, track deforestation, and inventory forest stands with GIS.
BUSINESS: More on the business side of things, GIS is for site selection, consumer profiling, and customer prospecting.
REAL ESTATE: Examples in real estate include market analysis, home valuations, and zoning.
PUBLIC SAFETY: GIS shows the spread of disease, disaster response, and public health.
What Can GIS Do For You?
Geographic Information Systems better answer questions about location, patterns, and trends. For example:
1. Where are the land features found? If you need to find the closest gas station, GIS can show you the way. GIS can find optimal locations by connecting traffic volumes, zoning information, and demographics.
2. What geographical patterns exist? In conservation, we want to know animal habitats using GPS collars and land cover. By knowing animal locations, we can correlate preferred land types with GPS locations. In the end, we have a massive database with all types of species of animals.
3. What changes have occurred over a given period of time? Time is the missing element in studying change. For example, we understand change through remote sensing of the environment. Also, we better predict disasters by finding changes over time.
4. What are the spatial implications? If a company wants to build a new project, GIS excels in storing environment data. Most environmental assessments use GIS to understand the impact of projects on the landscape.
What is Geographic Information Science (GISc)?
While GIS answers “what” and “where”, Geographic Information Science (GIScience) focuses on “how”.
How will GIS grow in the upcoming years? This is a question that Geographic Information Science understands best.
Geographic Information Science provides all the building blocks for Geographic Information Systems. It draws from computer science, mathematics, geography, statistics, cartography, and geodesy.
GIScience incorporates the knowledge from these fields into Geographical Information Systems.
- Geographic Information Systems connects what with the where.
- Geographic Information Science discovers how.
What are Geographic Information Systems?
You might ask yourself: Haven’t geographers been answering these questions for centuries? Yes, they have. But geographers can answer these questions much better with Geographic Information Systems.
When we first started recording inventories on paper maps, it was quite a tedious process. But what did we really need? We needed a GIS to record and store observations. Also, we needed a table to store the attributes of the data.
What’s the bottom line? Geographic information systems (GIS) let us interpret data understanding relationships, patterns, and trends. Then, viewing and analyzing data geographically impacts our understanding of our world.
- What is Geofencing?
- What is Remote Sensing? The Definitive Guide
- What is the Difference Between Geomatics and GIS?
References
1. Williams, Robert (1987), Selling a geographical information system to government policymakers. Papers from the 1987 Annual Conference of the Urban and Regional Information Systems Association.
2. Stefan Hahmann & Dirk Burghardt. How much information is geospatially referenced? Networks and cognition (Pages 1171-1189). Received 27 Jun 2012, Accepted 21 Oct 2012, Published online: 23 Nov 2012.
3. R. F. Tomlinson. A Geographic Information System for Regional Planning. Department of Forestry and Rural Development. Government of Canada, Published 1969.


It would be great if you had mentioned the published date, as it would be easier for reference. The overall content is amazing, as it helped me a lot to understand GIS.
firstly, thanks for all these information but I need steps to start build gis knowledge and work with it
Best thing to do is to start working with the software. QGIS is open source and the second most popular. I’d try out some MOOCs and tutorials in your available free time.
QGIS Tutorials – https://gisgeography.com/qgis-tutorial-how-to-use-qgis-3/
MOOCs – https://gisgeography.com/free-esri-training/
YouTube Channel – https://www.youtube.com/@SpatialZone
Thanks for sharing
Good information. Thanks.
Thanks for sharing.
Quite an important component in conservation. I hope it will continue getting us into where we want to be in as far as we want to use it as our security measure and research purposes.
Being an Esri employee, its good to see this article randomly poped up on my mobile news wall….love GIS💙
Courses regarding GIS
Informative content-worthy learning.
However, how can I use GIS to detect illegal water connections?
Very nice and important information provided
That study from 2012 that says 60% is pre IoT, 5G, and the self driving car boom. Current speculation is that its closer to 90.
Change detection using two different dates images giving output results. GIS application in remote sensing
If you combine the layers of data together to form one picture what is it called?
If it’s an analysis, it could be a merge, intersect, union, etc. More on that here – 7 Geoprocessing Tools Every GIS Analyst Should Know
How can I use GIS to detect illegal water connections?
With all I am seeing here, I am really lacking in my knowledge of GIS practicality because it’s only theoritically based. I’ve got little knowledge on how to manipulate devices in analyzing geographical data.
So informative and very interesting when I read GIS information but I coulden’t find any output of GIS so can provide some output of GIS?
Is this course marketable when it comes to employment
GIS is being integrated in different domains so I’d say it looks great on a resume as a complimentary skill. Here’s 1000 examples for applications and uses of GIS. https://gisgeography.com/gis-applications-uses/
I am an Hydrogeologist working with ministry of water resources. I am currently attached with a water laboratory where Physical, Chemical and Microbial analysis is being carried out by chemists and microbiologists. More than 500 water samples were being collected and data is being generated accordingly on each parameter on a quarterly basis. I am interested in GIS training. Which program on GIS will you recommend I start with for proper data interpretation and management in order to correlate the analytical results with geologic information of the water source. Thanks
How can i combine GIS to the internet of things technology ?
Where can I study GIS? I want to study it and be qualified in this field
Well. This is interesting.
1. Kindly provide guidance on how best I can use a mobile phone to electronically collect and send elecronically to data base geocodes of TB patient residencies and their DOT service point in a city setting.
2. Other than mobile phones what other gadgets can I use to collect this information.
1. There are better options nowadays than several years back. Collector for ArcGIS, QField for QGIS, Fulcrum, ArcPad
2. Tablet, laptop, PDA
This information is wonderful! Thank you!
What is the difference between GIS and other information systems?
Data in a geographic information system is referenced with locations (geographic coordinates). And using GIS software, you can visualize, edit, store and analyze that geographic data.
Discovering GIS, I will be needing it to help in marking out my traditional land boundaries for my land so that I can provide to local authorities in applying for my land tittle. Please can you suggest to me what GIS software will best help me?
There are a lot of options for open source GIS software – https://gisgeography.com/free-gis-software/
I am a mechanical engineer. Is this valuable for me to spend 2 years on an agreement in this GIS field? Please provide me a vision.
How can I find greenery area in satellite image by using GIS?
You can use NDVI. https://gisgeography.com/ndvi-normalized-difference-vegetation-index/
How can I use GIS to analyse the distribution of banks?
First, you’ll have to geocode the banks or get their lat/long coordinates. Next, you can create a heat map or some sort of visualization
What programs are best for analyzing low income housing, where it exists, where it does not and what potential parcels might be available for creating more? I’m interested in housing the homeless as well as creating new housing for lower income people in California.
You can usually obtain this type of data (zoning, parcels) from your local authority (state/county/city/town). It may be available on Esri Open Data (see below). The challenge for this is getting high quality data.
For example, where are empty lots? If your local authority can’t provide you with data where land is developed… Alternatively, you can download data from OpenStreetMap (see below) where the mapping community has already digitised the globe to a certain level of completeness. However, you should validate with the latest imagery to make sure… Using the zoning and parcel data from your local authority group, you can overlay the OSM data that you have validated. Check for homeless shelters in OSM or Google Maps.
Esri has some tapestry data where it characterizes neighborhoods. But it sounds like for your purpose, as you mention individual parcels, that it needs to be more detailed. Alternatively, you can use census data to help characterize areas.
Best options for data: https://gisgeography.com/best-free-gis-data-sources-raster-vector/
Look at #2 Esri open data, #4 OSM
You can also potentially use real estate data for empty lots. In the past, this has been a challenging exercise because our landscape is changing every day.
Well, out of 105% are 80% geographical data and 25% are not… That is either interesting or magic.
Thanks for that, I fixed it :)
I noticed a typo in the infographic. In the “Who Works” section, “remote sensing” is misspelled.
Thanks, I fixed it.
This is so informative. I never felt sleepy reading. Everything is well stated. Thanks! I could use it in our capstone.
This has been very informative and useful, thank you very much for this information.
I have used some information for a school report and have cited you in APA format like this:
GISGeography. (2016, 10 2). What is Geographic Information Systems (GIS)? . Retrieved from GISGeography: https://gisgeography.com/what-is-gis/
I hope this was correct and helps anyone else needing to cite this page.
Was this article created by GISGeography? I am interested in the infographic.
Thanks
Yes the infographic was created here. Please feel free to reuse if you’d like. If you can cite us somehow, that would be good… but you don’t have to
I described it all and lost it before it was posted. What I said was I hope to integrate GIS with Surveying since these should be two complementary tools. Maybe it’s just that those surveyors are “Out standing in their fields”. After 4 weeks, I’ve found that there is a lot more to it. “Gee. I thought it was going to be Simple” (GIS)