100 Earth Shattering Remote Sensing Applications & Uses
Remote Sensing Applications and Uses
How’d you like to see a list of some of the most amazing remote sensing applications and uses?
Well, consider yourself very lucky… because today we’re going to share some of the absolute BEST remote sensing applications with you.
Warning: you are not going to get the boring, generalized lists… Agriculture, forestry, weather, biodiversity… *yawn*
Whether you are a beginner or advanced, this list will change the way you feel about how remote sensing is changing our world and the way we think.
Agriculture
1. Determining soil moisture content using active and passive sensors from space
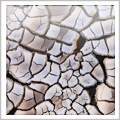
Soil moisture contributes so much to understanding Earth sciences… For example, it explains Earth’s water cycle, weather forecasting, drought, and floods. But did you know there are two ways to derive soil moisture from space? First, it uses passive and active sensors.
Active sensors like Radarsat-2 illuminate their target and measures backscatter. In turn, this results in high spatial resolution but low accuracy. Second, passive sensors like SMOS measures naturally emitted microwave radiation. Unlike active sensors, it gives a highly accurate but poor spatial resolution image. How can we get the best of both worlds? This is what NASA’s Soil Moisture Active Passive (SMAP) Mission strives to achieve.
READ MORE: The Big Satellite List. 50 Satellites. 30 Words or Less.
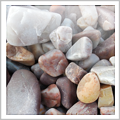
2. Mapping soil types for agriculture planning
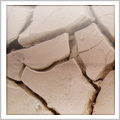
Over time, rocks break down into small pieces and become soil. With soil, water, and sunlight, together they give plants and other organisms a place to live. But not all soils were built the same. The need for accurate soil information around the world is soaring because of population growth and food security.
This is why the International Soil Resource and Information Centre (ISRIC) has placed soil mapping as a key priority. ISRIC has developed a methodology to predict spatial soil properties in 1 km grid cells at a global level – ISRIC’s 1 km Soils Grid Map. Also, scientists used covariates such as climatic indices (based on MODIS imagery) and conventional soil surveys to create these global spatial prediction models.
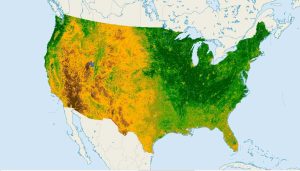
3. Quantifying crop conditions with Normalized Difference Vegetation Index (NDVI)
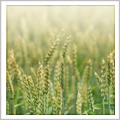
The global food supply is being monitored with satellite imagery and the Normalized Difference Vegetation Index (NDVI). Near-infrared radiation is being used to detect healthy vegetation in agriculture. Healthy vegetation reflects green light and absorbs red and blue light.
The green light that our eyes see is chlorophyll created by plants during photosynthesis. Chlorophyll will reflect more light in the green and near-infrared spectrum compared to other wavelengths. This is why near-infrared radiation in combination with NDVI is one of the primary remote sensing applications in agriculture and the environment.
4. Saving money and time on the farm with precision farming
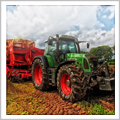
Precision farming is like a hidden goldmine in agricultural production. Savings estimate 10% in fertilizer. On top of that, crop yields are also improved. Precision farming uses different wavelengths of light to see how healthy crops are.
Variable amounts of fertilizer are worked out keeping money in farmers’ pockets. Also, remote sensing in agriculture helps identify pests for better control and management on the farm.
Archaeology
5. Predicting the occurrence of dinosaur tracks for paleontologists
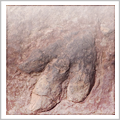
Remote sensing gives insight into understanding exactly where dinosaurs once roamed the Earth. Cantwell Foundation lists four primary geospatial factors in the occurrence of fossil sites.
These four factors are vegetation coverage, slope, aspect, and proximity to landslides and all can be obtained using remote sensing. Forget about doing guesswork and put your best foot forward.
6. Unearthing ancient archaeological sites like the Mayans and ancient Egypt
Unearthing ancient archaeological sites must be one of the neatest remote sensing applications on the list. Remote sensing applications in archaeology include infrared and stereo imagery. Infrared radiation has longer wavelengths and can penetrate around a meter of depth on the surface.
Stereo imagery shows subtle variations in elevation on the ground. It was a bit of a surprise when archaeologists found square patterns on the ground over vegetation growth. These square patterns are of course ancient buildings and pyramids. Scientists have already discovered ancient Mayan and Egyptian civilizations using photogrammetry and infrared imagery.
Arctic/Antarctica
7. Calculating the depth of snowpack
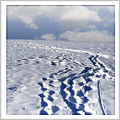
Forget about putting on your winter jacket and scarf for measuring snowpack depth. Snowpack is the accumulation of snow over extended periods of time. Specifically, they feed into rivers as the snow melts. This is why snowpack makes an important source of information for flood control and drinking water.
As you can imagine, there is a high level of difficulty measuring the depth of snowpack. NASA has had the most success using LiDAR and a spectrometer as part of their airborne mission to measure snowpack depth. Both these variables explain the absorption of sunlight and the rate of snowmelt.
8. Exploring, protecting, and navigating in the Arctic
Things are kind of in flux now for ‘who’ is claiming ‘what’ in the Arctic. The US, Russia, Canada, and the Danish are all staking their territory. But no one can tap the Arctic until all countries come to an agreement.
Mineral extraction, natural gas, as well as potential shortcuts for shipping routes – the Arctic may be one of the last great frontiers for human development. Heavy-duty tasks like sea ice monitoring, ship tracking, and national defense make satellites a heaven-sent opportunity for maintaining sovereignty in the North.
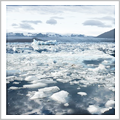
9. Studying glacier melts and their effects on sea levels
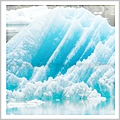
Glaciers hold the largest freshwater reservoir on Earth. You can find 99% of glaciers in the Polar Regions. NASA’s GRACE satellite showed that the Alaskan glaciers were losing mass at about 20.6 gigatonnes per year.
But the scary takeaway is the rapid melting of ice and its profound effects on sea levels. This alarming trend emphasizes the pressing need for global cooperation in mitigating climate change and adopting sustainable practices.
Business
10. Predicting retail earnings and market share by counting cars in a parking lot
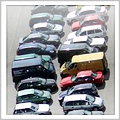
Looking for remote sensing applications with a great return on investment? Investors find using satellite imagery at big box store parking lots gives the most bang for their buck.
Companies like RS Metrics count the number of vehicles in parking lots. In turn, this gives a snapshot of earnings, conversion rates, and market share. All things considered, it’s a simple high-tech strategy that can give market analysts the information needed.
11. Getting a top-down view when purchasing real estate
When you’re in the market to purchase a home you want a complete view of the property and surrounding area. Potential buyers are interested in knowing schools, shopping districts, and parks before their home purchase.
This is why the use of satellite imagery in real estate has been a real growth segment. It also allows everyone in the home-buying process a top-down view. Appraisers, insurance companies, and lenders can get a quick glimpse of the home through the convenience of the Internet.
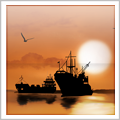
12. Catching fish and improving long-term fisheries sustainability
There is plenty of fish in the sea from a satellite viewpoint. Satellites monitor sea surface temperature and ocean colors because they are indicative of specific fish species.
Local fishermen can use remote sensing data to save time and fuel in real-time. In terms of remote sensing applications in fisheries and the marine environment, we can map out algal blooms that are harmful to aquaculture. This improves overall long-term sustainability.
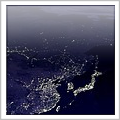
13. Mapping regional economic activity at night
We’re giving glowing reviews for night-time remote sensing applications. The total amount of radiance gives insight into regional economies, access to electric power, and distribution of income.
Higher radiance correlates with Gross Domestic Product and has also been compared with human well-being. Who would’ve thought you could learn so much by mapping economic activity at night?
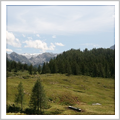
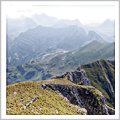
14. Planning spine-jarring black diamond ski runs with aspect data
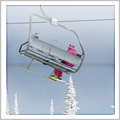
In countries like Canada and Russia, the territory is wide and below freezing for a good portion of the year. The mountainous terrain is ideal for ski resorts. But with so much ground to choose from, site selection is more difficult.
This is why recreation planners are turning to laser technology for planning ski resort locations. Aspect data refers to the horizontal direction a mountain slope faces. The greater the angle, the more black diamond ski runs.
Climate Change
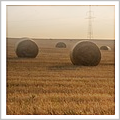
15. Identifying forest stands and tallying their area to estimate forest supplies
Global forest supplies are being monitored because they not only provide valuable materials (think construction, paper, packaging…). But they also absorb roughly one-third of carbon dioxide emissions.
AVHRR, MODIS and SPOT quantitatively measure the loss and gain of our global forests. These advanced satellite technologies provide invaluable insights into the intricate dynamics of Earth’s ecosystems, aiding conservation efforts and informed decision-making for a more sustainable future.
16. Comparing climatic factors from past to present
Understanding the state of our climate has immeasurable importance. NASA is mapping different climate factors on a monthly basis to see how much these variables change in Global Time-Series Climate Maps.
Through this lens, we can map out climate variables like carbon monoxide, chlorophyll, and aerosol size as a function of time. Remote sensing satellites include MODIS, CERES, AMSR-E, TRMM, and MOPITT. Never in our history have we understood Earth’s climate as we do today.
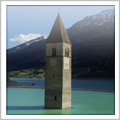
17. Measuring the rise of sea levels
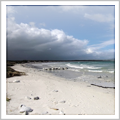
Every year Venice is sinking a little more. Measuring the rise of sea levels is a perfect example of a large-scale application done cost-effectively. There is no need to go on the beach and bring out your measuring stick at sea level all along the coast.
In order to understand sea level rise, you need good baseline spatial data. Measuring sea level rise is a function of time with centimeter accuracy measurements using remote sensing data.
18. Comparing the past and present with human impact change
The Landsat missions are the longest-running Earth observation missions ever. Its digital records date back to the 1970s. If we want to understand landscape change, the Landsat missions give us a snapshot back in time. We can learn from the past for future generations.
Oil spills, deforestation, wars, chemical spills, dead zones, and smog are unnatural, man-made disasters. We can prevent them all and watch them from space. For example, this Esri story map shows how human activities are reshaping Earth’s surface using Landsat imagery.
Crime
19. Spotting swimming pools for late-night dives
Not all satellite imagery is used for good intentions. If you own a swimming pool, it may be a target for a strange craze called ‘dipping’. Teenagers have been using aerial and satellite imagery on Google Earth to locate swimming pools.
At night, they would take an impromptu dip in any of the largest pools they could find. This activity is of course trespassing (which is a crime). In other words, don’t try this at home, kids.
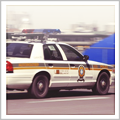
20. Narrowing down a search for a missing body
Remote sensing can save time, money, and manpower in locating missing people. Crime detectives want to narrow down their search before they go on a quest.
Remote sensing tools can explore the search area with a fine-tooth comb and pick up anomalies on the ground. This could include anything from a rabbit hole to the crime scene, itself. This is truly a time-saver if you have a rough idea of the search location.
21. Putting illegal boat dumping under the microscope
When a boat was dumped illegally with all identification removed in Santa Rosa County, crime investigators took their search to Google Maps. Using historic aerial and satellite imagery, they went on a hunt for its rightful owner.
Piecing together clues from the past, they embarked on a captivating journey that unraveled a forgotten tale of ownership. What crime investigators found was the same boat and the address of the illegal dumper. Case closed.
Disasters
22. Monitoring active volcanoes using thermal remote sensing
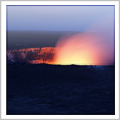
Volcanoes form when hot molten rock from the upper mantle finds its way to the surface. Eruptions are dangerous to humans and the surrounding environment. There are over 600 active volcanoes on Earth.
Volcanoes are often inaccessible (unless you are Mario or Luigi) making remote sensing applications like thermal and mid-infrared clear solutions for understanding volcano activity. AVHRR and MODIS are prime candidates for volcano monitoring.
23. Inventorying potential landslides with interferometry
Landslides are often under-represented in hazard research. But every year in the United States, landslides cause loss of life and billions of dollars in damage.
The first step in inventorying potential landslides is using stereo and optical images with slopes. Slope instability triggers can be several things – earthquakes, erosion, poor drainage, and more. InSAR can provide early warning signs for landslides because of how well it measures ground surface displacements.
24. Quantifying the damage after an earthquake
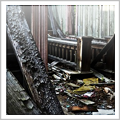
The result of an earthquake can be catastrophic and at times difficult to assess. But an earthquake assessment is essential for rescue workers. They need to be done quickly and with accuracy.
Object-based image classification using change detection (pre- and post-earthquake) is a quick way to get damage assessments. Other remote sensing applications in disaster assessments include casted shadows from buildings and digital surface models.
25. Assessing terrain stability using interferometry in the oil and gas sector
Active sensors use phase differences to measure landscape deformation using interferometry. Industries like the oil and gas sector monitor terrain stability using these types of remote sensing applications for better safety standards.
Over time, continual satellite data means higher safety and ensures pipeline productivity. This consistent stream of satellite data not only enhances safety protocols but also optimizes overall pipeline efficiency, ushering in a new era of reliability in energy transportation.
26. Tracking hazards for better response and recovery
There’s been a clear upward trend in the number of disasters over the years. This means better preparedness for mitigation as well as response and recovery.
The integration of Earth observation data and GIS in hazard situations has become the main tool in disaster management. Remote sensing applications for hazards include assessing the extent of damage and assisting dispatch.
Ecology
27. Counting polar bears to ensure sustainable population levels
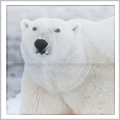
The sad story about the polar bear is that it is listed as one of the first animals that will become extinct because of global warming. Ecologists are turning to satellites as their primary source of information because they need a firm count on polar bears for their survival.
So… How do you know the difference between a polar bear and a big white rock? In two images, polar bears moved, while rocks stayed in the same spot.
28. Uncovering habitat suitability and fragmentation for panda bears in protected areas
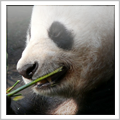
Giant pandas eat bamboo for 99% of their diet making them the ultimate bamboo-holic of the animal kingdom (think alcoholic but bamboo). Habitat is important for pandas.
This makes roads and infrastructure ecological armageddon for pandas. In order to protect the endangered panda, remote sensing classifies fragmentation and man-made corridors as factors.
29. Tracking the great distances of migratory birds and inspecting their prevalence
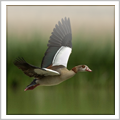
Birds travel great distances in search of food, climate, and breeding sites. Light-weight GPS telemetry is just one of the tools being used to know where birds migrate. As forests become more limited, migration patterns are important for wildlife managers.
Remote sensing applications like LiDAR, multispectral, and radar can show forest properties like vertical structure and phenology. Habitat suitability models predict the prevalence of bird species using these forest properties.
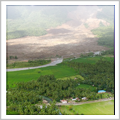
30. Using a least-cost analysis and vegetation to understand wildebeest migration
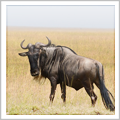
Tanzania hosts one of the greatest migrations on Earth. More than 2 million wildebeests migrate and give birth in the same month. The purpose of migration is to locate food resources.
But can we model their movements? Research has shown that variables like vegetation (NDVI) and relief (slope) are drivers for wildebeest movement patterns. However, rainfall may also have an impact on migration patterns as well.
31. Using habitat suitability models to predict the abundance of mosquitoes
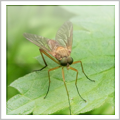
Habitat suitability models are making some interesting predictions on the abundance of mosquitoes. Remotely-sensed factors such as greenness, brightness, temperature, and especially moisture positively correlate with the over-occurrence of mosquitoes.
Knowing the location of high concentrations of mosquitoes can guide risk assessment for disease-carrying pathogens and mosquito fogging efforts. By pinpointing these mosquito hotspots, public health officials can strategically deploy resources.
Elevation
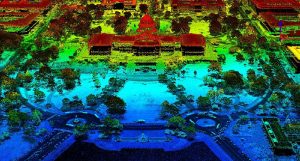
32. Mapping with laser precision using Light Detection and Ranging technology

If Dr. Evil was a geographer, LiDAR would be his weapon of choice. I can see it now, pinky in the mouth saying “bring out the laser”. LiDAR measures the distance from the airborne platform to Earth’s surface using laser beams.
This is how LiDAR got its name – “Light Detection and Ranging”. What makes LiDAR so special is its densely sampled points at laser accuracy. LiDAR generates point clouds for digital surface models, digital elevation models, and light intensity.
33. Estimating surface elevation with the Shuttle Radar Topography Mission
Imagine you are a surveyor and your crew chief asks you to survey the whole world. You need to map 30-meter grid cells and are given only 11 days. What would you say? I’d expect some profanity…
This is essentially what NASA’s Shuttle Radar Topography Mission (SRTM) did in 11 days. The secret to its success is Interferometric Synthetic Aperture Radar, a technology that enables precise and detailed imaging even through challenging weather conditions and terrain obstacles.
34. Deriving elevation and contours using photogrammetry
Photogrammetry dates back to the mid-nineteenth century. It is used to find the geometric properties of objects by measuring distances between objects.
Some of its derived products in GIS include contour mapping, surface models, volumetric surveys, and 3D mapping. It’s also used in other fields such as crime scene mapping, archaeological excavations, and architecture.
Engineering/Construction
35. Planning an optimal telecom network capacity
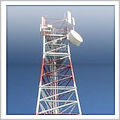
It’s estimated that 87% of the world’s population now uses mobile devices. The astounding rate of growth in this industry requires extensive planning for optimal network capacity.
Telecommunications companies use remote sensing because it’s a cost-effective way to optimize capacity requirements. Radiofrequency coverage can be augmented with the appropriate antenna type, location, and direction. Satellite-derived terrain, land use, and other environmental factors can be modeled to achieve optimal network capacity.
36. Designing a lift irrigation system to supply water
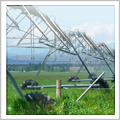
A lift irrigation system can improve water supply for agriculture and other industries. Planning the design of lift irrigation systems requires a wide range of data.
Satellite stereo image pairs and photogrammetry are particularly useful for generating datasets like digital terrain models. The engineers can get a full view of the ground before commencing construction.
Environment
37. Monitoring the environment with the ESA’s Copernicus Program
As for remote sensing applications in the environment goes, the European Space Agency (ESA) Copernicus Programme may be the most ambitious yet. The goal is to achieve a completely autonomous monitoring system.
Its purpose is simple – understand the health of the Earth. Copernicus’ six Sentinel satellites collect comprehensive pictures of the following themes: land, ocean, emergency response, atmosphere, security, and climate change.
38. Keeping a watchful eye on biodiversity
Biological diversity (biodiversity) is the wide variety of animals and plants in a geographic location. With the spatial and spectral resolutions of sensors improving year by year, remote sensing applications in biodiversity are beginning to play a larger role.
It remains in the early development stage but strides are being made using hyperspectral and 3D vegetation structures using LiDAR. Researchers are optimistic that this integration of cutting-edge technologies will lead to a comprehensive and accurate understanding of ecosystems, opening doors to more effective environmental monitoring and management strategies.
39. Delineating and assessing the health of riparian zones to conserve lakes and rivers
Riparian zones are the wooded areas along the water’s edge. They are the last line of environmental defense from nutrient runoff for our lakes and rivers. As water spans the entire globe, riparian zones are there serving their duty.
Of all remote sensing applications in the environment, riparian zones perhaps require the highest spatial resolution because of their small width. A Landsat-8 pixel might not be able to do the job here.
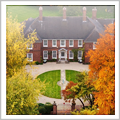
40. Assessing the environmental change and promoting biodiversity in parks
There’s no kidding around the importance of parks. Not only do parks provide a home for a large number of animals and species at risk, but they often prohibit urban development.
Parks can be large in scale making them a difficult resource to manage. Remote sensing data gathered over time can show landscape change. Some remote sensing applications in parks include mapping biodiversity, invasive species, and forest fire risk.
Forestry
41. Fighting wildfires by planning firefighter dispatch
Wildfires cause serious damage to property and even loss of life. For these reasons, there is a need to control wildfires and lessen their impact. Based on satellite data, firefighters can dispatch with pinpoint accuracy.
Operational satellites like AVHRR and MODIS are best suited because of their mid-infrared and thermal bands. Also, satellites can trace the extent of wildfires using temporal data.
42. Reversing illegal rainforest cutting in Brazil
The Surui tribe in Brazil has teamed up with Google to reverse rainforest deforestation. The Surui tribe is equipped with high-tech tools like Google Earth, smartphones, and GPS. They keep a watchful eye on illegal mining and logging.
The good news is that miners and loggers have retreated and illegal activities are at their lowest levels in history. The information potential with satellites for understanding illegal rainforest cutting is enormous as part of Google Earth Outreach to the Surui Tribe.
43. Preventing the spread of forest disease types
Billions of people depend on healthy forests for their livelihood. The rapid spread of forest disease can have catastrophic effects on ecosystem health and local or national economies.
The mountain pine beetle has infested over 17.5 hectares of forests causing distinct color changes. Because remote sensing monitors for these color changes, forest managers can better track the occurrence of forest diseases such as the mountain pine beetle.
Government
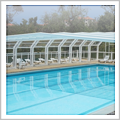
44. Catching tax evaders red-handed by locating new construction and building alterations
If you thought you could hide your home addition or swimming pool from your tax return without the city noticing… If you lived in Athens, Greece, you’d be wrong. The tax revenue agency in Athens, Greece is looking for signs of wealth using satellite data.
Not a bad idea that more than 15,000 swimming pools went unclaimed to tax authorities in 2010. The money-strapped country is looking at increasing its tax revenues using remote sensing applications using satellite imagery.
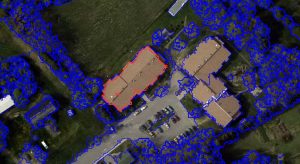
45. Detecting land cover/use types for decision making
“Land cover” is the physical property of the surface. “Land use” explains how land is being utilized. When a mayor of a city targets a 50% urban tree canopy, spatial resolution matters. A Landsat pixel spans multiple parcel boundaries and is not a realistic representation of a tree canopy.
The Spatial Analysis Laboratory (SAL) of Vermont compared the National Land Cover with object-based classification and found it was significantly underestimated (11% vs 39%). A mayor would be very embarrassed to know their objective is almost exceeded.
46. Assisting cities in managing assets and ensuring safety standards
Some cities use mobile LiDAR to manage their assets and ensure safety standards. Each year, cities and municipalities issue thousands of permits for construction. This massive volume of permits makes it difficult for cities to manage activities.
Using mobile LiDAR collection and comparing it with municipal data, you can ensure construction activity is safe and properly permitted. Road conditions, utilities, billboards, and sign inventories are some of the other remote sensing applications in asset management.
47. Keeping an inventory of cemeteries using UAVs
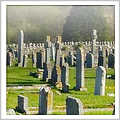
The Czech Republic implemented a system to map cemeteries using unmanned aerial vehicles UAVs. Over 80,000 graves were captured at 1 cm pixel resolution.
Not only was this faster than manually recording each cemetery in the field, but a digital record of the imagery remains. UAVs were a low-cost and highly accurate solution for cemetery mapping. The result was a spatial database and tax dollars saved.
48. Recognizing buildings easily with the bird’s-eye oblique view
There’s some sort of irresistible magnetism people have for the bird’s eye oblique view. Pictometry’s Oblique Imagery are the specialists of oblique image photography.
The logic behind it is that when you view the world at a 45-degree angle, it’s much easier to recognize land features (like from an airplane window). This is why Google and Bing Maps have added this functionality to their interfaces.
Hydrology
49. Delineating watersheds using DEMs for hydrologists
A digital elevation model determines where and how water flows in a watershed. Hydrologists are interested in the hydrologic budget when they study watersheds. Inputs are precipitation, surface flow, and groundwater flow.
Outputs are evapotranspiration, infiltration, and surface runoff. Remote sensing contributes to watershed delineation by providing accurate elevation data. Digital elevation models are used to accurately represent streamflow paths and the contributing areas with software systems like HEC and Geo-HMC.
50. Locating groundwater activity for wells
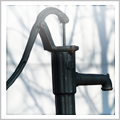
Earth is surrounded by water in the form of oceans, rivers, and lakes. At the ground below your feet is even more water in the form of groundwater. An aquifer stores groundwater. There are thousands of wells that draw water from aquifers.
This water is being used in agriculture, drinking water, and more. This is why it’s important to have good spatial knowledge of groundwater. Groundwater activity can be understood by its rock types, soil, land use, and rainfall. Remote sensing groundwater prospect zone maps are used to locate well sites.
51. Preventing the degradation and loss of wetland ecosystems
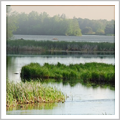
Once seen as a nuisance in agriculture, wetlands are being drained and lost. Suddenly, they have become a rare precious resource. Wetlands serve many purposes.
They help purify water, control flooding and improve shoreline stability. This is why remote sensing applications to inventory wetlands have grown so much over the years.
Insurance
52. Charging higher insurance premiums in flood-prone areas using radar
Ever notice your home insurance premium sky-rocket from the previous year? You might have to thank a geographer for that. Some of the unique GIS and remote sensing applications that insurance companies use include radar and hydrological modeling.
Geographers can map out areas more prone to flooding, how often these areas would flood, and how badly the damage could be. In turn, this helps them better assess risk.
53. Doing the detective work for fraudulent crop insurance claims
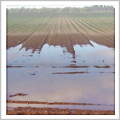
As the climate becomes less predictable and more destructive (such as droughts and floods), farmers have to adapt to this new reality. In this case, crop insurance can help farmers supplement their income when their fields don’t get seeded.
But what happens when farmers commit crop insurance fraud? This is why insurance companies and the USGS have teamed up to investigate any wrongdoing. For example, the USGS measures vegetation growth using Landsat’s red, infrared channels in combination with NDVI. Using this information, crop insurance companies can verify seeded crops and catch fraud.
Military
54. Spying on enemies with reconnaissance satellites
Militaries are harnessing the power of satellite imagery to retrieve intelligence on enemies. As for remote sensing applications, reconnaissance satellites go all the way back to the 1950’s US Corona Program.
Its purpose was to spy on the Soviet Union and China after the war. But satellites have come a long way from taking photographs and parachuting down to the surface. Now they’re so secretive that if they told you… well… who knows what they would do to you
55. Snapping aerial photos for military surveillance using messenger pigeons in World War II
Never trust a pigeon as your photographer. No matter what the occasion is, weddings, birthdays, and times of war. Pigeons almost never follow their flight path and almost never return cameras to their owners.
These were the hard lessons learned when the German military used the Bavarian Pigeon Corps to do their dirty work and spy on enemies.
56. Searching for aircrafts and saving lives after fatal crashes
Of all remote sensing applications, there may be no other that touches the heart as much as saving another life through search and rescue. Hundreds of satellites orbit the Earth each day.
Each one has its own life-saving ability – but only if it’s in the right time and place. This also applies to defense and military uses and applications as well. The ingenuity of using pigeons for espionage, while intriguing, underscores the unintended consequences that can arise from unconventional wartime tactics.
57. Navigating ships safely with the most optimal route
Imagine. The Titanic had GPS positioning and stirred clear from the iceberg. Hundreds of lives were saved and husbands around the world could’ve avoided watching the Leo and Kate romance movie about it.
But the harsh reality is that icebergs still threaten ships 100 years after the Titanic sunk. Ship navigation has improved. GPS is not the only ship navigation tool. Other remote sensing applications in ship navigation include routing analysis, wind and wave information, and ship proximity.
58. Picking up on signals from submarines in shallow water
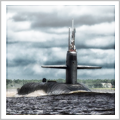
Submarines have the reputation of being excellent spies because they are capable of operating underwater. Much research on using earth observation data to track submarines has been kept on the down-low.
But new insights indicate some capacity to detect submarines at shallow depths. Satellites might see subtle undersea disturbances caused by submarines using SAR. Another indicator may be vibrations in ocean temperatures using infrared detectors. This means submarines may have no place to hide at all.
59. Spotting undeclared nuclear power plants automatically
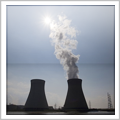
The International Atomic Energy Association plans to verify the absence of undeclared nuclear power plants. A typical nuclear power plant contains at least one circular cooling tower with thermal emissions possibly being released.
Nuclear plants are also located near bodies of water and are more than often connected with a road or railway. Given this set of criteria, the use of object-based classification and multispectral imagery aims at automating the search for undeclared nuclear power plants. Not a bad start – 5 out of 5 were already successfully automatically identified.
60. Recording video footage from satellites
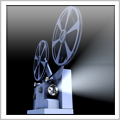
A new, innovative approach that has entered the market is satellite video. Some remote sensing applications include watching airplanes depart/land, examining rush hour traffic, and spying on your neighbor.
These can all be done from the comfort of your own home, all movie footage courtesy of satellites. The future may be for remote sensing software applications to process videos, instead of still images.
Mining
61. Extracting mineral deposits with hyperspectral remote sensing
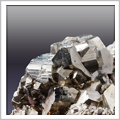
There are over 4000 natural minerals on Earth. Each one has its own chemical composition. This is equivalent to saying that each composition has its own spectral reflectance.
Having more spectral bands like hyperspectral sensors gives the potential to map more minerals. There is some predictability with remote sensing applications for geology and minerals. After spotting one mineral, almost certainly other specific minerals accompany it.
62. Studying the geology of the Earth’s surface
Geology is one of the rare things that stay constant in our lives. Every landscape, plant, and animal we see today is affected by the rocks, material, and nutrients. All have an origin in geology.
Some of the remote sensing applications in geology include bedrock, lithological and structural mapping. Multispectral spectral reflectance has provided valuable information on rock composition while radar has also been useful in studying surface roughness.
63. Measuring the volume difference at a uranium enrichment site using 3D mapping
SAAB’s Vricon Rapid 3D Mapping System is really how to make your data come to life. Multiple 3D satellite images can be combined to understand change detection in the third dimension.
Using five satellite acquisitions and the 3D mapping system, the volume difference at a uranium enrichment site was successfully mapped in Iran. This achievement showcases the potential of advanced satellite technology to monitor and verify nuclear facilities, enhancing transparency and international security efforts.
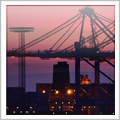
64. Monitoring oil reserves by looking at floating oil roof tanks
All it takes to monitor oil reserves from the sky is a bit of geometry and some high spatial resolution imagery. Oil tanks are usually circular with a floating roof tank to prevent evaporative losses.
Satellites can look at how much shadow is being casted in relation to the floating roof. More shadows mean fewer oil reserves. Remote sensing applications like this make use of satellite imagery without having to physically measure each oil tank.
Navigation
65. Pinpointing your position on Earth with Global Positioning Satellites
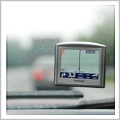
In May 2000, the GPS switch (also known as selective availability) was flicked. Suddenly, accuracy has changed from the size of an airport to the size of a small shed. GPS has led the way for great innovative products like car navigation systems and unmanned aerial vehicles.
It’s no wonder why the GPS has been ranked one of the top 50 greatest breakthroughs since the wheel. Its unparalleled impact on navigation, communication, and countless modern technologies highlights the profound influence GPS has had on shaping the way we navigate and interact with the world.
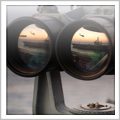
66. Providing a base map for visual reference and assisting in orienting the map reader
Orthoimagery provides an extreme amount of detail of the focus and surrounding areas. Maps always communicate a message. As maps are location-based, aerial imagery assists readers to orient themselves.
It provides context and reference information and can instantly provide the lay of the land. And nowadays, there are so many sources to choose from such as Bing, Google, Open Street Maps, and NASA’s Globeview.
67. Measuring gravity with the GRACE satellites
This may be one of the neatest remote sensing applications on the list – measuring gravity. NASA’s Gravity Recovery and Climate Experiment (GRACE) consists of two satellites in the same orbit approximately 220 kilometers apart.
When the leading satellite increases speed, this means there is a greater gravitational pull. If the leading satellite slows down, this means there is less gravitational pull. These pulls in gravity are measured using microwave pulses from one satellite to the other. The result is the most accurate measurement of gravity to this date.
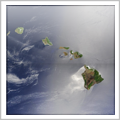
68. Looking at the Earth as an art masterpiece
Some of the most breathtaking views are from space. Evidence of this is in NASA’s 75-page collection of Earth images (NASA’s Earth as Art) seen from space.
The collection of Earth observation images was taken from the Terra, Landsat, EO-1, and Aqua satellites. In this Earth art masterpiece, you can find some of the most intriguing patterns and geometry of our oceans, atmosphere, and land features.
69. Spinning the globe with mapping services like Google Earth, Bing Maps and OpenStreetMaps
Who doesn’t like spinning the globe on Google Earth? Don’t lie. I know you do. Google Earth gives us an interface with updated satellite and aerial imagery at our fingertips for free.
The convenience of knowing your location before you go with Streetview is mind-blowing. Who would’ve thought decades ago you could travel the world eating nachos in the comfort of your own home.
Oceanography
70. Detecting oil spills for marine life and environmental preservation
Oil spills have profound effects on marine life and the surrounding environment. An oil spill requires a quick response so the oil doesn’t disperse. Satellites can maximize the search for oil slicks.
Not only can satellites determine the extent of the oil spills, but they can also identify the direction and rate of oil movement. This computer model uses current, ocean, and weather forecasts, also obtained by remote sensing.
71. Watching algae grow as an indicator of environmental health
Watching algae grow is about as much fun as watching paint dry. But you can learn a lot about a lake’s health by studying algae. It’s an indicator of the amount of nitrogen and phosphorous being fed into the lake.
Reducing nutrients is important because it affects local economies like fisheries and tourism. This is why NASA is using hyperspectral sensors to learn the biochemical properties of algae blooms and even predict their locations as part of NASA’s Lake Erie Project: Algae Growth.
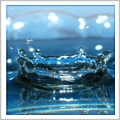
72. Observing the flow of ocean currents and circulation
Water covers 70% of the Earth with most of it in oceans. And ocean currents connect all oceans mainly driven by winds at the surface. But deep below the surface, salinity and temperature control currents.
Satellites can achieve an enormous wealth of information on ocean currents and circulation. Ocean Surface Current Analyses – Real-time (OSCAR) is a near-real-time global ocean circulation data set based on NOAA and NASA’s sea level altimetry, surface winds, and sea surface temperature.
73. Mapping the mysteries of our ocean floors
In this day and age, we have most of the world mapped. The world is at our fingertips with a wide range of open source mapping applications. The next challenge is mapping the ocean floor.
ESA’s CryoSat-2 and NASA’s Jason-1 satellites have pieced together the most complete picture of our ocean floor and subfloor features. The pull of gravity reveals underwater mountains and seafloor topography.
74. Snorkeling in an oasis of marine vegetation with the coastal channel
Snorkel in an oasis of marine vegetation using Worldview’s coastal channel. Because of its finer level of spectral penetration in coastal areas, underwater reefs and bathymetric mapping make for some unique remote sensing applications.
These capabilities hold immense potential for marine research, resource management, and conservation efforts, ushering in a new era of understanding and preserving our oceanic environments.
75. Tracking sediment transport into rivers and lakes
Sediment loading is one of the most profound anthropogenic factors in aquatic systems. It affects industries like tourism, fisheries, and ecological functioning. It would be useful to understand exactly where suspended solids enter and leave.
The reflectance of water in satellite imagery increases with more suspended solids. But in order to monitor nutrient loading, we need continual coverage and temporal analysis.
Society
76. Monitoring the global sex trade situation in remote areas
The global sex trade is a growing international crime where one’s rights are violated through commercial exploitation. Often involuntary, the flow of human trafficking has been tracked using the latest satellite imagery from NASA.
The flow of human trafficking often crosses boundaries and is done secretively. Remote sensing makes it possible to overcome these barriers and provide evidence for human trafficking globally.
77. Finding the driving factors that contribute to poverty
Remote sensing is exploring some of the driving factors that contribute to poverty. Governments can get a clear picture of poverty and provide concentrated support to those in need.
Studies have shown how agricultural use, natural resources, and other environmentally determined factors link to poverty. Researchers assess all these contributor factors with remote sensing.
78. Preventing the spread of diseases in epidemiology
The birth of epidemiology came shortly after Jon Snow mapped the spread of cholera from a contaminated pipe in 1854. Ironically, this was also the birth of Geographic Information Systems. There is a clear connection between epidemiology and geography.
Some diseases are best-suited for climate, land use, and air. Remote sensing applications in health use these remote sensing data and prediction models to understand epidemiological processes.
79. Understanding the human rights situation in North Korea
Remote sensing can give an in-depth look at hermit kingdoms like North Korea. Remote sensing enables what some travelers may never get to see in their lifetime. Ostrich farms, breweries, towers – all uniquely North Korean.
But satellites also enable us to see the darker side of North Korea. Those wanting to escape North Korea are sent to prison camps. These camps are clearly seen from the skies.
80. Providing early warning signs for a famine on a large scale
Governments want early warning signs for famine to deliver appropriate food supplies to areas of shortage. Early warning signs for famine have been developed which incorporate vegetation growth and crop yield forecasting.
Flooding and drought can be better understood with satellites like SMAP and SMOS. Remote sensing satellites go from moving around orbit to moving our understanding of global famine.
81. Observing population growth in urban areas using land use change
Urban planners want to know population growth and distribution to optimize development and improve the well-being of citizens. Land use change can be modeled to provide an accurate measure of population growth.
Not only is it accurate, but the land cover provides more detail for population growth distribution within cities and census tracts.
82. Helping provide clean drinking water with base maps
Water is life’s most basic need. But nearly 1 billion people live without clean drinking water. The first step in solving this problem is identifying areas that require water. High spatial resolution satellite imagery can really differentiate where water shortages exist.
This is the starting point of an action plan. Simple remote sensing applications like base maps can positively affect the lives of millions by establishing where and who needs essential resources like water.
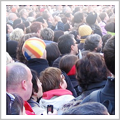
83. Measuring the size of protests for journalists
How big is the size of the protest? It’s something journalists always want to know because it quantifies how strong people’s opinions are on a subject matter. Counting every head in a protest can put you to sleep, as it does with sheep.
With differing spatial resolution, you can at least see how big the crowd is. But to provide the best estimate, you need the area and density of protesters – both can be roughly obtained by remote sensing data.
84. Keeping a watchful eye to prevent future atrocities from happening
Atrocities often result in a change in the environment, destruction of buildings, and migration of people. They can occur in secretive areas with military regimes restricting access.
For these reasons, remote sensing applications and imagery are keeping a watchful eye on atrocious acts. GaTHR (Geospatial Technology for Human Rights) is using this approach to help those who are victims. Specifically, satellite remote sensing provides legal evidence, to help on-the-ground coordination and prevention of future illegal activity.
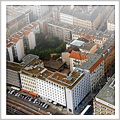
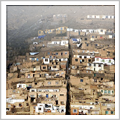
85. Finding ghost cities on the map
If you build it, they will come. Well, not really in the case of China’s “ghost cities”. Some of the most peculiar satellite imagery shows the construction of apartments, shopping malls, and other amenities. But practically nobody lives there.
Economists have their eyes on China to push global economic growth. What they’ve found is that GDP and employment numbers may be deceiving, if resources are improperly being allocated to sectors without demand. Satellites can indicate how real or artificial economic growth is.
86. Tracking displaced refugees to help deliver aid and services
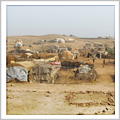
A solution to tracking refugees and camp conditions is satellite imagery. The United Nations High Commissioner of Refugees (UNHCR) wanted to deliver aid and services to Sudanese refugees in Tongo.
They needed a clear understanding of the situation at Tongo refugee camps. UNHCR mapped the influx of refugees, agriculture, waterways, and infrastructure using satellite imagery. As a result, UNHCR was able to better manage and deliver aid where it was needed most.
87. Keeping tabs on the shift from rural to urban growth
We’ve experienced an increasing number of people migrating from rural to urban areas. Urbanization is linked to industrialization. 50% of people are now living in urban areas and according to the United Nations, this pattern will continue.
Urbanization is an interesting phenomenon that can be clearly seen as impervious surfaces from satellites. This visual evidence from satellites not only provides insights into urban growth patterns but also underscores the need for sustainable urban planning to balance development with environmental preservation.
Transportation
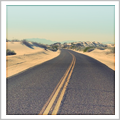
88. Inventorying and assessing rural road conditions with UAVs
How safe are your roads? Transportation planners have been taking some Earth advice on unpaved roads. With the integration of remote sensing and GIS, unmanned aerial vehicles are providing answers on pothole detection, washboard analysis, and crown conditions for unpaved roads.
With centimeter accuracy, rural road conditions can be assessed and inventoried saving time and money. This innovative approach not only streamlines maintenance efforts but also contributes to safer and more efficient rural transportation networks, benefiting both communities and infrastructure management.
89. Driving with no hands (autonomous vehicles)
If Google’s self-driving car got pulled over by the cops, how would it react? The first secret behind the car is the LiDAR which detects pedestrians, cyclists, stop signs, and other obstacles.
Put this together with GPS, inertial measurements, and a really sophisticated piece of software, and you have a self-driving car. This remarkable integration of technology paves the way for a new era of transportation, where autonomous vehicles can navigate and adapt to their surroundings with unprecedented precision and reliability.
90. Covering the most ground in search of road cracks
Some constructive advice is to cover more ground with remote sensing data. The city of Solvang, California is taking its road management issues very seriously. In one complete shot, public works used satellite images to locate damaged paving.
Road managers can better serve the public if they know exactly which roads are in desperate need of repair. By harnessing satellite data, road managers can prioritize maintenance efforts and allocate resources more effectively, ultimately leading to safer and more reliable road networks for the community.
91. Assessing fuel economy of vehicle emissions
Governments have been putting pressure on vehicles to meet emission standards. Satellites can monitor fuel economy and emission standards with minimal interference from the sky. Multispectral remote sensing can measure vehicle emissions such as CO, HC, and NO.
Governments have toyed around with the idea of imposing surcharges based on distance-driven and improperly maintained equipment. Satellites offer a golden opportunity to control pollution from motor vehicles.
92. Creating an automated road network
Urban planners, emergency crews, and navigation systems require up-to-date road networks. As new neighborhoods sprout up, it’s challenging to keep road network databases updated.
An approach using multispectral images and object-based classification has automated the tedious process of generating road networks. One of the key challenges has been differentiating parking lots from roads.
93. Improving efficiency and safety of air traffic control
Air traffic control directs aircrafts from the ground to prevent collisions and improve the flow of traffic. Unfortunately, there are excessive dollars and emissions wasted on inefficient routes.
The next generation of air traffic moves from ground-based radar to a satellite-based GPS system. The new air traffic control system aims at improving routes, reducing traffic delays, and saving money. It also intends to assist planes to land faster and help navigate through the weather with the use of satellites.
94. Reducing traffic jams using change detection
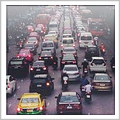
Our increasing populations and urbanization have led to increasing amounts of traffic in urban centers. Traffic jams mean wasted fuel and time. Ground measuring systems provide extremely precise traffic volumes but it’s limited to selected roadways.
We can monitor traffic density using change detection. Traffic analysts can compare two satellite images with slight lags. This shows traffic movement over a larger picture.
Weather
95. Measuring wind speed and direction for wind farms, weather forecasting, and surfers
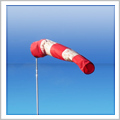
Golfers, farmers, pilots, engineers, and wind turbine planners need accurate wind information. Weather balloons and GPS are a good way to do this. But it’s not the only way.
NASA’s QuickSCAT scatterometer and wind LiDAR are making these large-scale wind observations too. These technologies help us understand global wind patterns and their impact on weather systems, contributing to improved weather forecasting and climate modeling.
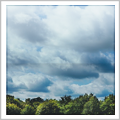
96. Forecasting weather to warn about natural disasters
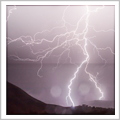
Remote sensing applications like weather forecasting and monitoring are fundamentally important for businesses, athletes, and tourists. In 1975, the Geostationary Operational Environment Satellite (GOES-1) started collecting wind, temperature, and other atmospheric data.
But GOES-1 was only limited to a small portion of the Earth. A lot has changed since then. We are now on GOES-12, 13, 14, and 15 with improving temporal, spectral, spatial, and radiometric resolution.
97. Monitoring air quality in the lower atmosphere
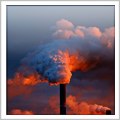
The pollution is so high in some cities that it’s the equivalent of smoking a pack of cigarettes each day. 80% of these over-polluted cities are in China. One of the major pollutants is carbon monoxide.
Carbon monoxide is colorless to the human eye but not for MOPITT (Measurements of Pollution in the Troposphere) on NASA’s Terra satellite. MOPITT uses a spectrometer to measure upwelling infrared radiation in the lower atmosphere.
98. Watching the aurora borealis from another angle
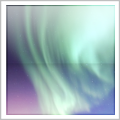
When charged particles interact with Earth’s magnetic field, they actually slam into the gases of our atmosphere. The different colors we see are from different gases.
If you’ve watched the Aurora Borealis from the ground, you might want to try from up above. One of the most surreal videos is watching the International Space Station’s view of the Aurora Borealis.
99. Measuring albedo for Earth’s radiation budget
Albedo measures the percent of reflected sunlight. A darker surface will heat up quickly and absorb sunlight. Brighter surfaces like snow reflect much sunlight back to the atmosphere.
Albedo is a key component in the Earth’s radiation budget. In order to calculate the total albedo, we can assign an albedo value to each land cover type. Multiply albedo with the land cover type and sum to measure total albedo.
100. Optimizing solar panel energy output with global horizontal irradiance
Energize your search for endless solar panel input. If you were going to choose a single location anywhere on Earth to install a solar panel, it would have to be the Global Horizontal Irradiance (GHI) map.
GHI measures the rate of total incoming solar energy at the Earth’s surface in watts per square kilometer. Decades of satellite data (derived from GOES and Meteosat) have generated this data with a standard error of only 5%. This remote sensing data brings some serious heat.
Remote Sensing Examples in Summary
Satellite information is fundamentally important if we are going to solve some of the major challenges of our time.
For issues like climate change, natural resources, disaster management, and the environment, remote sensing provides a wealth of information on a global scale. What we get are answers to these problems so we can make informed decisions.
There are endless possibilities of benefits to society from remote sensing. With higher spatial, spectral, and temporal resolution, the future of remote sensing is promising.
If we are going to take on some of the biggest challenges of Earth in the near future, we need remote sensing to cover that much ground.
Thanks to @NASA_Landsat for the Tweet!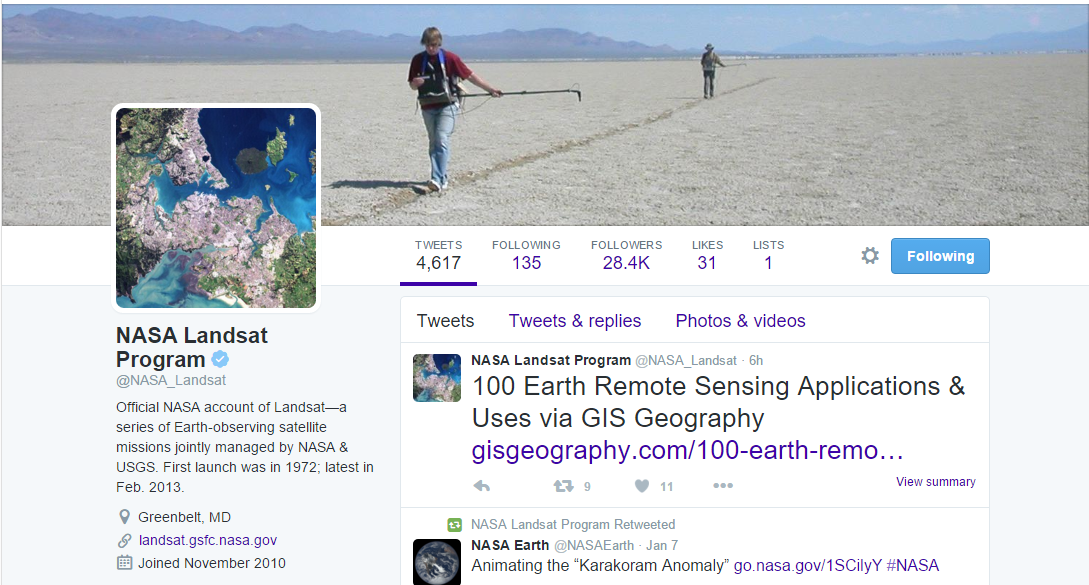
…And thanks to NASA Terra Satellite!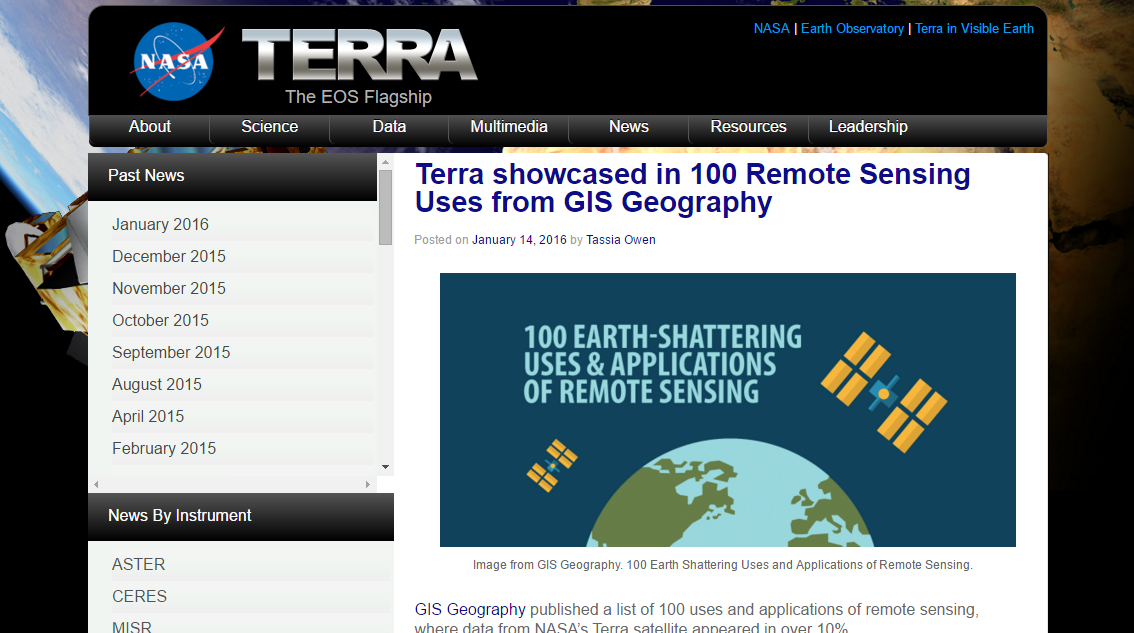
wow, you have expanded my knowledge in where else to use this module
Really relatable to my real estate industry. Very insightful.
The information is useful, I have learnt a lot. It is going to help me in my study of land suitability evaluation for crops in South Sudan.
Great article! Thanks)
Thanks for the information, I really learn alot. Pls can you enlighten me more on how to carry out “Covering the road ground in search of road cracks”. I will like to do that for my project research and also like you to suggest research topic for me related to my discipline. I’m a land surveyor. Thanks
How can I study the Spatial and temporal changing pattern of agricultural production/ productivity yield and prediction of a certain area using RS and GIS application?
What is the best project title for Mt. Canlaon Volcano in Negros Occ. in relation to hazards,damage assessment if in case it will erupt.
Hi. I was hoping to use this article as a cited source in an undergrad class. Is there an actual author to this article I can attribute this to?
Please just use the website address for the citation. Thanks
This is very helpful. I would like more detailed information about increasing tax revenue using RS/GIS. How do I find the sites?
I believe the swimming pool detection for increased tax revenue is from this research paper: https://www.inderscienceonline.com/doi/abs/10.1504/IJIM.2016.083911
Hi GISGeography,
Big fan here of the website. I really like explanations for some major common tasks we do as GIS folks and breaks it down to where even non GIS folks can follow. Anyway my company doesn’t know anything about GIS/Remote Sensing, I’m the only GIS guy here. They don’t realize how much data we have to process or look through. The computers provided for us simply can’t handle UAV data and other large image files, point clouds, or DEMS etc. I finally convinced them they have to upgrade, but I’m not exactly sure what hardware, processors or graphic cards to give them for the new computer purchase. What works best for handling GB’s worth of data? Also which software package works best for processing rasters and loading rasters? I’ve found Global Mapper runs much faster than ArcGIS. In school I used ErdasImagine and loved it but my company won’t approve of that software. I have GRASS, QGIS, and ILWIS installed but I hadn’t had the time to familiarize with them yet. ArcGIS Pro I hear is faster than arcmap, I hadn’t dabbed with it much yet either. I need a new personal laptop for the image processing and mapping software as well as a desktop computer. What processors, graphic cards, RAM, etc will be needed for GBs and TBs worth of data, so I’m not crashing my programs or spending my whole week watching the loading icon?
Hi Peter
I appreciate the kind comments. Unfortunately, I may not be too much help, and this may require some thorough testing and a future post on the topic.
For LiDAR, I’ve found the LP360 extension to work well in ArcMap, as with Drone2Map and Birdi. Yes, GlobalMapper handled point clouds with relative ease and is one of the best options on the market. Actually, last time I looked for open source alternatives, nothing really seemed to satsify. I did like Whitebox GAT for open source LiDAR handling, and there might have been some upgrades since last release.
As for computer hardware, there’s so many choices it’s hard to give any type of straight-forward guidance. As you mentioned, lots of RAM and high end graphics card. Two monitors. It’s best not to be cheap for hardware.
Sorry, I couldn’t be too much help
Thanx for this technology. Very excellent. I have been given a course work on relating rainfall with land cover change for the entire country (Uganda). Could you give me some tips how am supposed to do this? Which resolution and which kind of imagery data I should download. Thank you so much
You can use this for global land cover, if you don’t have anything local for Uganda. https://gisgeography.com/free-global-land-cover-land-use-data/
Here are some weather data sources as well. https://gisgeography.com/gis-weather-data-sources/
If not, give Esri’s open data portal. From here, it would be a matter of running an intersect using the rainfall and land cover data. Run an area calculation and perform a cross-correlation analysis. This would be the simplest way to do it, but I’m sure there are other statistics you could run.
What’s important is having good inputs. So check those GIS data sources thoroughly
Thanks a lot. I would like more detailed information about unearthing ancient archaeological sites. How do I find what sites?
Here’s an example how LiDAR is being used to find ancient Mayan sites.
http://archive.archaeology.org/1007/etc/caracol.html
Thanks for the information. It has been really helpful for my assignment and research
Excellent compilation. Learned lot of new applications and new free satellites available.
Thanks a lot
Didn’t realize that GIS and RS is used in so many different areas and aspects of our everyday life. This definitely helped me with me with my assignment. Thanks!
These remote sensing applications has added on what I already know and has helped me a lot on how remote sensing is important
Very useful collection of information. Thank you GIS Geography
These application of remote sensing have helped me alot in my research.Thanks
Applications of RS given in the site are awesome according to me