Mapping Overlays in GIS

DEFINITION:
Mapping overlays is the process of layering different maps on top of each other to analyze how different types of geographic data relate to each other.
Map Layer Overlays
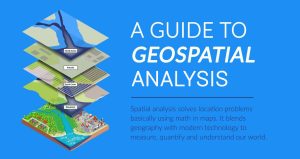
Mapping overlays in GIS work like stacking layers on top of each other. Each layer represents a different data type, such as roads, rivers, or population.
By placing these layers together, we can see how different features interact in the same space. For example, overlaying a pollution layer with a population layer shows where health risks might be higher.
Overlays can also show changes over time. So, they’re helpful ways to analyze geographic data and improve decision-making.
Overlay Analysis Tools in GIS

Overlay tools in GIS analysis combine layers of data to see how they interact and relate. For instance, you can overlay a land use map with environmental data to identify at-risk areas.
They help answer questions related to geography, like where to build without harming natural habitats. Overlay tools use techniques like intersecting, merging, and clipping to mix data layers.
They’re especially useful for analyzing geographical changes over time. For example, you can track deforestation or urban expansion. By layering historical and current maps, we can visualize changes and predict future trends.
Examples of Map Overlay Operations
Interestingly, the use of overlays has changed how we use GIS. From simple mapping to more complex spatial analysis, we can overlay dozens of layers.
Here are some of the most common map overlay examples that we use in GIS:
Intersect
Finds common areas between layers. The Intersect tool retains attributes between all overlapping features.
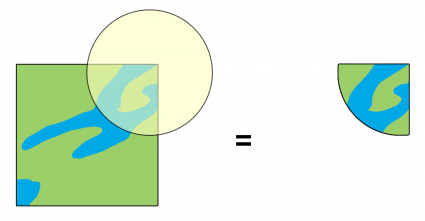
Merge
Combines several layers into one. The Merge tool aggregates points, lines, and polygon vector features.
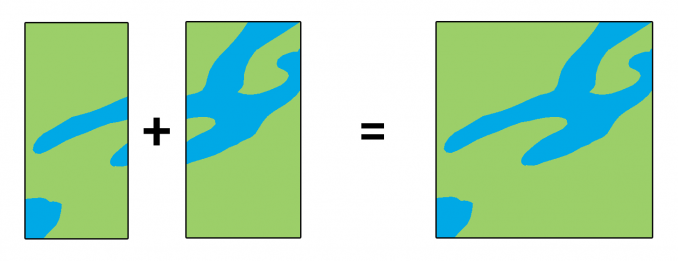
Erase
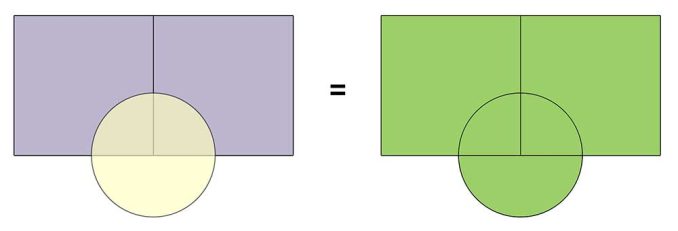
Removes all areas that overlap one another. The output of the Erase tool includes all features that fall outside the erase features.
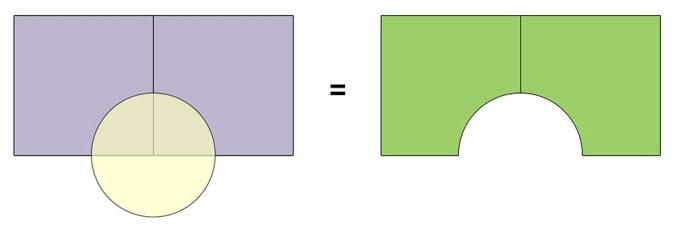
Clip
Cuts out a piece of one layer using the boundary of another. Attributes only remain from the input features using the Clip tool.

Dissolve
Combines adjacent boundaries based on common attributes. The Dissolve tool melts boundaries based on the same attribute.
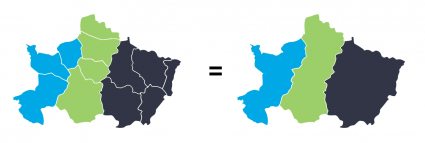
Each overlay operation has its unique application. But the goal is to understand spatial relationships between geographic features.
History of GIS
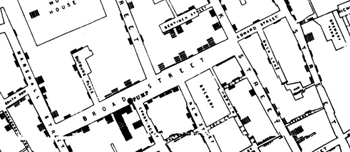
The Cholera Outbreak
A cholera outbreak hit the city of London, England. British physician John Snow began mapping cholera locations, roads, property boundaries, and water lines. John Snow performed one of the first mapping overlays in history. He overlaid water pump locations with cholera cases. By doing mapping overlays, he found a connection between water pump locations and cholera cases. This historic moment in GIS led to the creation of the field of epidemiology.
Mapping Overlays in GIS
Mapping overlays in GIS extract geographic data using geoprocessing tools. By layering different datasets, they allow us to see how they interact in geographic space.
Which mapping overlays do you use the most? Please let us know in the comment section below.

