1000 GIS Applications & Uses – How GIS Is Changing the World
1000 GIS Applications & Uses
Struggling to find GIS projects for you or your students? Read the list.
Not sure what to say when someone asks what GIS can really do? Read the list.
Looking to diversify your business and services? Read the list.
One year in the making, these are some of your favorite GIS applications you haven’t heard of yet:
GIS student project ideas, GIS case studies, GIS projects, GIS uses – From over 50 industries, this jam-packed guide of 1000 GIS applications will open your mind to our amazing planet and its interconnectivity.
Agriculture

1. Precision Farming – Harvesting more bushels per acre while spending less on fertilizer using precision farming and software. (How to win the farm using GIS)
2. Disease Control – Combating the spread of pests by identifying critical intervention areas and efficiently targeting control interventions.
3. Swiss Alps Farming – Cultivating south-facing slopes in the Swiss Alps using aspect data because it shelters from cold and dry winds which is critical to successful crop growth.
4. 3D Scanners for Biomass – Measuring with laser accuracy 3D biomass using the FARO scanner.
5. Real-time Crop Yields – Shifting to real-time crop monitoring and targeted, automated responses with drones and precision watering sensors.
6. Current Food Security – Safeguarding food insecure populations by establishing underlying causes through satellite, mobile-collected, and GIS data storage.
7. Agri-tourism – Navigating through crop mazes with GPS receivers in the developing field of agri-tourism.
8. Plant Hardiness – Defining distinct boundaries in which plants are capable of growing as defined by climatic conditions.
9. Machine Performance – Logging geographic coordinates of agricultural machinery in a farm field to better understand the spatial variability cost of field operation and machinery performance.
10. Future Food Demand – Diagnosing the future food demand and planning how to fulfill the needs of a growing and increasingly affluent population.
11. Crop Assimilation Model – Simulating soil, water, and crop processes to better understand crop productivity and monitoring using the Crop Assimilation Model tool in GRASS GIS.
12. Water Stress – Balancing the ratio of local withdrawal (demand) over the available water (supply).
13. Historical Agricultural Land – Plotting the historical and future farming trends served.
14. Hunger Map – Raising awareness about global hunger and places that are in need.
15. Agromap – Breaking down primary food crops by sub-national administrative districts and aggregating by crop production, area harvested, and crop yields.
16. Crop Resilience to Climate Change – Adapting to climate change and shifting weather patterns by promoting the continued health of your fields.
17. Crop Productivity – Calibrating crop productivity using indices like Normalized Difference Vegetation Index (NDVI) to estimate global crop productivity. (Satellite Image Corporation AgroWatch Green Vegetation Index)
18. Erosion-Productivity Impact Calculator (EPIC) – Prioritizing cropland conservation program implementations through “Model Simulation of Soil Loss, Nutrient Loss, and Change in Soil Organic Carbon Associated with Crop Production”.
19. Agriculture Capability – Classifying the varying potential for agricultural production using the Canadian Land Inventory.
20. Ranch Pasture Management – Collecting soil types, fence lines, roads, and other data for better management for more meaningful reports and maps.
21. Agricultural Pollution – Quantifying the impacts on climate and the environment from agricultural pollution.
22. Agriculture Revenue – Determining the Effective Opportunity Cost relating to deforestation and potential agricultural revenue with IDRISI GeOSIRIS for REDD.
23. Irrigation – Capturing irrigation infrastructure for land management decisions more than two-thirds of the world’s freshwater withdrawals are for irrigating crops.
24. Farm Preservation – Establishing farm priority zones by analyzing the local farming landscape and constructing criteria for high-quality farming areas.
25. Versatile Soil Moisture Budget – Simulating soil moisture conditions of cropland areas taking into account evapotranspiration, rainfall, runoff, and other factors.
26. Drought – Minimizing the impact of drought by analyzing the spatial distribution of rainfall and real-time sensors like SMAP, SMOS, and synthetic aperture radar.
27. CropScape – Estimating acreage of crop types and spatial distribution using satellite imagery with National Agricultural Statistics Services. (USDA NASS CropScape)
28. Crop Forecasting – Predicting crop yields using NDVI, weather, soil moisture, soil types, and other parameters.
29. Organic Farming – Managing various sources of data for organic farming permits including tillage history, field inputs, crop rotations, and pest management measures on a field-by-field basis.
30. Agricultural Non-Point Source (AGNPS) Model – Predicting the effects of agriculture on water quality using the Agricultural Non-Point Source pollution model in MapWindow
31. Drainage Ditches – Tracing farm field drainage lines using stereo imagery in MicroImages TNTMips. (TNT Stereo Viewing Tools)
32. Length of Growing Period – Meeting the full evapotranspiration demands of crops when average temperatures are greater or equal to 5°C and precipitation plus moisture stored in the soil exceeds half the potential evapotranspiration.
Astronomy
33. Asteroids – Gazing the sky and tracking asteroids with NASA’s bolide events map. (NASA’s Bolide Events)
34. Mapping Mars with MOLA – Start mapping a whole entire new planet using NASA’s MOLA. (USGS Planetary GIS Web Server – PIGWAD)
35. Mars Terrain – Going for a spin on the rugged terrain of Mars using data captured by the Mars Orbiter Laser Altimeter (MOLA) instrument on the Mars Global Surveyor (MGS). (Mars Terrain)
36. Mars Rover Landing – Examining how to land the Mars Rover safely with operations criteria including latitude for solar power, soil softness, slopes using laser altimetry, dustiness, rockiness, and a landing footprint.
37. Water Flow on Mars – Hillshading the Mars Digital Elevation Model to augment legibility and understand where rivers may have flowed and oceans flourished. (Mars Water Flow)
38. Satellite Orbits – Gazing the sky for satellites and even programming satellites for image acquisition. (Satellite Map)
39. Magnetic Fields – Investigating magnetic field lines in 3D with international geomagnetic field maps.
40. Astrogeology – Delivering planetary mapping to the international scientific community in the public domain – from planetary topology to lunar geology. (Astrogeology Science Centre)
41. UFO Sightings – Speculating UFO sightings with proportional symbols with over 90,000 reports dating back to 1905.
42. Light Pollution – Recognizing the artificial light introduced by humans in the night sky and how it interferes with the observation of stars. (NOAA’s VIIRS data) / Light Pollution Map)
43. Mars in Google Earth – Searching for Martian landmarks with Google Earth’s “Live from Mars” layer.
44. International Space Station – Tracking the real-time location of the International Space Station (ISS) in ArcGIS Online Data.
45. Venus – Mapping the altimetry, shaded relief, and geology of Venus.
46. Magnetic Declination – Positioning with the magnetic declination, a varying angle from a true geographic north using NOAA National Geophysical Data Center 2015 data and the Magnetic Declination QGIS Plugin.
47. Gravity Anomaly – Understanding our Earth’s gravity by mapping the unusual concentrations of mass in different regions on Earth. (The Geoid)
48. NASA Visible Earth – Cataloging images and animations of our home planet in the electromagnetic spectrum from various sensors. (NASA Visible Earth)
49. Tycho – Mapping Tycho, the youngest moon crater.
50. Milky Way – Surveying the inner part of the Milky Way Galaxy with GLIMPSE (Galactic Legacy Infrared Midplane Extraordinaire)
Archaeology

51. Lost Cities – Revealing lost cities in the ground by using ground-penetrating radar and infrared sensors. (LiDAR uncovers lost cities)
52. Archaeological Survey – Tackling huge problems archaeologists face every day – collecting physical locations of their excavation findings from a wealth of sites.
53. Middle Eastern Geodatabase for Antiquities – Recording, monitoring, and protecting archaeological sites to avoid impacting, factor cost for site mitigation – developed by the Getty Conservation Institute (GCI) and the World Monuments Fund (WMF). (MEGA Geodatabase)
54. Geographic Text Analysis – Incorporating a semi-automated exploration of written texts combining Natural Language Processing techniques, Corpus Linguistics and GIS.
55. QGIS Archaeology Tools – Computerizing the archaeological community with their record-keeping with the pyArchInit QGIS plugin.
56. Mediterranean Landscape Dynamics – Modeling surface process change and landscape evolution to better understand the long-term interactions of humans and landscapes in the Mediterranean using GRASS GIS.
57. Preliminary Site Investigation – Searching ancient maps for buildings, cemeteries, roads, and fences as these sites present important clues to archaeological sites.
58. Stone Tools – Characterizing geographic features suitable for making stone tools and clay pottery such as lithic materials, water resources, stream hydrology with geologic controls like bedrock outcrops and drainage basin floodplains.
59. Viewshed – Scoping out a site by determining what is within eyesight considering all prehistoric conditions associated with that viewshed.
60. Archaeological Site Prediction – Connecting favorable slope, aspect, geology, hydrology, and distance to water using the Multiple Criteria Evaluation (MCE) to predict archaeological sites.
61. Cultural Heritage Inventory – Customizing and deploying the collection of cultural heritage field observations with open source geospatial software Arches. (Arches Heritage Inventory & Management System)
62. 3D Archaeology – Rendering accurate and efficient 3D recordings of archaeological heritage sites, in particular, archaeological excavations with aerial imagery and 3D environments.
63. Shovel Test Pits – Logging transects, shovel test pits, and other recordings when they visit potential locations to conduct field investigations.
64. Predicting Dinosaur Tracks – Getting the inside track on understanding exactly where dinosaurs once roamed the Earth with vegetation coverage, slope, aspect, and proximity to landslides.
Architecture

65. Line of Sight – Planning high-rise buildings so they don’t obstruct the view of the mountains in Portland using the line of sight tool. (3D Analysis Tools)
66. Exposure to Noise – Orchestrating urban mobility plans with special consideration for the impact of environmental noise using OrbisGIS. (Urban Noise)
67. Development Planning – Making citizens happy through smart development planning and understanding the bigger picture.
68. Crowd Simulation – Mastering the collective dynamics of interacting objects in urban phenomena at the scale of individual households, people, and units of real estate and at time scales approaching “real-time”. (Crowd Simulation)
69. Solar Exposure – Harvesting light to assess the suitability of installing solar (photovoltaic) panels on roofs using 3D city models and geometric information such as the tilt, orientation, and area of the roof.
70. City Engine – Assessing feasibility and plan implementation using Esri’s City Engine improving urban planning, architecture, and overall design.
71. Pedestrian Behavior – Discerning the movements of pedestrians and urban behavior throughout a plaza in Copenhagen.
72. Shadow Analysis – Diagnosing the amount of casted shadow in the pre-construction phase onto its surrounding using Bentley Map.
73. Parking Availability – Orchestrating parking available by collecting the percent of spaces occupied versus search time.
74. Integration of GIS and BIM – Operating a facility with BIM (building information modeling) because of its ability to analyze information and integrate data from different systems. (Indoor Mapping)
75. Tangible Landscape – Experimenting with the potential impact of different building configurations with an easy-to-use 3D sketching tool. (Tangible Landscape)
76. Geodesign – Conceptualizing building plans with a focus on stakeholder participation and collaboration to closely follow natural systems. (Geodesign)
77. Propagation of Noise in Urban Environments – Modelling 3D data to answer how urban citizens are harmed by noise pollution, and how to mitigate it with noise barriers. (Noise Pollution)
78. Space Utilization – Augmenting NASA’s Langley Research Center by applying optimization algorithms to space utilization. (Space Utilization)
79. Ordnance Survey Geovation – Pioneering location innovation in the United Kingdom through Geovation – the collaboration, exchange of ideas, and inspiring innovation. (Ordnance Survey Geovation)
Arctic/Antarctica
80. Quantarctica – Familiarizing yourself with the Antarctic with the free, open-source source collection of geographical datasets.
81. Exclusive Economic Zones – Carving out boundaries in the Arctic – Canada, Norway, Russia, Denmark (via Greenland), and the United States are limited to their economic adjacent to their coasts while all waters beyond are considered international water.
82. Shipping Route Shortcuts – Transporting goods through the Arctic passage because of melting ice in the North Pole.
83. Sea Ice Motion – Maintaining an inventory of sea ice extents snapshots from NOAA’s National Snow and Ice Data Center. (Sea Ice Motion)
84. Aspect – Using aspect and incoming solar radiation data to understand how glaciers accumulate on the poleward side.
85. Subglacial Lakes – Mapping lakes under glaciers – isolated from the outside world for up to 35 million years, and may be final refuges for life, the like of which exists nowhere else on Earth. (Subglacial Lakes)
86. Antarctic Digital Magnetic Anomaly Project (ADMAP) – Uncovering the tectonic evolution using near-surface magnetic anomaly data. (Antarctic Magnetic Anomaly)
87. Wildlife Tracking – Logging the species richness of marine mammals like whales, seals, walruses and narwhals, and seabirds or waterfowl in the Arctic.
88. Sea Ice Index – Bringing together data on Antarctica’s ice sheet surface, thickness, and boundary using passive remote sensing. (Sea NSIDC Ice Index)
89. Fish – Showing the probability of occurrence and observations for fish species – from Atlantic cod to Walleye Pollock. (Commission for the Conservation of Antarctic Marine Living Resources)
90. Arctic Research Projects – Displaying research projects, showing available data, and exploring possible collaborations. (Arctic Research Projects)
91. Arctic Ocean Floor – Sculpting the Arctic Ocean with the sonic depth finder and discovering dynamics with trenches, ridges, and abyssal plains.
92. Arctic’s Geology – Interpreting the geology of the Arctic using enhanced magnetic data, Landsat imagery, and topographic data. (Arctic Geology)
93. COMNAP Facilities – Mapping out the COMNAP facilities in Antarctica that currently supports a range of scientific research. (COMNAP Facilities)
94. Polar Bear – Keeping counts of the most vulnerable populations of polar bears (due to climate change) by comparing two satellite images over time.
95. Search and Rescue – Lunging into search and rescue operations using the Safety and Operability Index which calculates risk based on factors such as sea ice, visibility, temperature, and distance from SAR resources.
96. Environmental Risk – Assessing the environmental vulnerability of marine resources with respect to oil spills as external stressors. (Arctic Environmental Risk)
97. Polar Ice Melt – Monitoring the polar ice melt using satellites like GOCE and GRACE that measures how much mass is on Earth. (GOCE and GRACE Satellites)
Aquatics
98. Stream Order – Defining stream size based on a hierarchy of tributaries the Strahler Index (or Horton-Strahler Index) – an important indicator of fisheries and aquatic habitat.
99. Fish Habitat Models – Connecting fish species with their habitat using habitat suitability indexes.
100. Whale Tracking – Stalking pigmy killer, sperm, beaked and false killer whales in the Pacific Ocean with online mapping applications.
101. Global Shark Tracker – Monitoring shark recovery rates with acoustic tags allowing detection in multiple dimensions. (OCEARCH)
102. Fish Eradication – Eradicating Northern pike which negatively affects local trout fishery and the economy by tracking their movements with GPS.
103. Spawning Sites – Drawing spawning site boundaries for migratory fish that are known to release eggs.
104. Hydro-Acoustics – Listening to echoes with hydro-acoustics for the Crean Lake Hydro-Acoustics project – capturing lake depth, fish class, fish stock numbers, and habitat preference related to temperature. (Crean Lake Hydro-Acoustics)
105. Mercury in Stream – Grasping the origin of mercury – which are contaminants to fish tissue – by studying the landscape such as soils and humus.
106. Fish Habitat Conservation Areas – Fine-tuning fish habitat conservation areas by knowing the big picture of fish distribution.
107. Overfishing – Maintaining sustainable fish population levels with satellite monitoring of sea surface temperature and ocean colors (because they are indicative of specific fish species).
108. Stress Monitoring – Correlating fish stresses from the local environment such as heat stress from the removal of trees along a stream.
109. SCIMAP – Identifying locations of diffuse pollution risk for polluted water and aquatic habitat using SCIMAP. (Diffuse Pollution Risk Mapping)
Aviation

110. Live Air Traffic – Turning your computer into an air traffic control center using Flight Radar 24. (Flight Radar 24)
111. Airplane Identification – Pointing your phone to the sky and identifying airplanes above you using Flight Radar 24.
112. World’s Busiest Airports – Surfing the world’s top 25 busiest airports with the Esri Global Crossroads Story Map. (World’s Busiest Airports)
113. Voronoi Diagram – Discovering that Mataveri Airport in Easter Island is the most remote airport in the world with the Voronoi airport proximity map. (Voronoi Diagram)
114. Obstruction Evaluation – Securing safe take-offs and landings with the Federal Aviation Agency’s (FAA) vertical obstruction database
115. Flight Path – Simulating flight paths integrated with elevation data, imagery, and other spatial data using Falcon View.
116. Search for Flight MH370 – Crowd-sourcing the search for flight MH370 with satellite imagery provided by DigitalGlobe.
117. Airspace Builder – Visualizing the air available to aircraft to fly in with 3D volumes using NASA’s World Wind. (NASA World Wind)
118. Air Traffic Control – Fine-tuning air traffic control with a common operational picture for security vulnerability and land use permitting.
119. Drone No-fly Zones – Delineating drone no-fly zones where it’s illegal to fly such as near airports and military bases.
120. Aeronautical Charts – Scouting out the best routes, safe altitudes, and navigation aids in the sky with aeronautical charts.
121. Runway Approach Zone Encroachment – Pinpointing obstructions in the approach zone of a runway using detailed elevation data to ensure no collisions FAA Safety Analysis.
122. Airport Sound Exposure – Assessing the relationship between aircraft-generated noise levels and land uses, noise receptors, and demographics in the airport environs.
123. Fly Through – Cruising the high altitudes with interactive 3D viewing and fly-throughs with Landserf. (Landserf)
124. Flight Simulator – Becoming a pilot in the cockpit with three-dimensional perspective views of an area by combined with elevation and imagery. (Online Flight Simulator)
125. Air Space Review – Automating the dissemination and portrayal of Special Activity Airspace information via OGC Web Services. (Envitia Special Air Space)
Automobile

126. Toyota Vehicle Crowd Sourcing – Piecing together hyper-precise and up-to-date maps using the Toyota vehicle’s GPS and camera.
127. In-Vehicle Usage – Monitoring driving habits like speed, sudden acceleration, and pushing hard on the brakes for insurance underwriting.
128. GeoFencing – Immobilizing cross-border travel with geofencing (virtual barriers) – perfect for car sharing and rental programs. (To Geofence or not)
129. Self-Driving Vehicles – Sitting back and relaxing while Google’s autonomous car does all the work equipped with LiDAR, GPS, an inertial unit, and sophisticated software. (Google’s Self-Driving Car)
130. GPS Receivers – Nurturing mapping technology as it’s almost standard to have a GPS receiver and a monitor with all the latest maps.
131. Waze Real-Time Driving – Saving time and money on your commute as drivers share real-time traffic information and road alerts with each other with Waze. (Waze Live Map)
132. Estimated Travel Time – Locking in your destination and getting live updates for estimated travel time.
133. Morgan Freeman’s Voice – Enjoying the calm, soothing voice of Morgan Freeman as he delivers directions from your GPS navigation system. (Morgan Freeman GPS)
Banking

134. Market Share – Examining branch locations, competitor locations, and demographic characteristics to identify areas worthy of expansion or determine market share.
135. ATM Machine – Filling in market and service gaps by understanding where customers, facilities, and competitors are with address locating, database management, and query tools.
136. World Bank Economic Statistics – Slicing and dicing raw financial data from the World Bank. (World Bank Data)
137. Merger and Acquisitions – Profiling and finding opportunities to gain and build where customers are with market profiling
138. Supply and Demand – Identifying under-served areas and analyzing your competitor’s market.
139. Community Reinvestment Act (CRA) – Fulfilling the obligations to loan in areas with particular attention to low- and moderate-income households – using GIS to understand spatial demographics.
140. Mobile Banking – Capturing locations where existing mobile transactions occur and assisting in mobile security infrastructure.
Business

141. Fleet Management – Staying in route and solving scheduling problems with fleet management. (Network Analysis)
142. Augmented Reality – Augmenting reality with commercial use in mind – such as advertising and restaurant reviews. (Google Glass)
143. Direct Marketing – Revitalizing selling strategies by reaching out to customers directly with locational intelligence.
144. Drive-Time Analysis – Determining a trade area based on how long a customer must drive to get to the store – factoring in street speed limits, traffic volumes, and other impedance.
145. Internet of Things – Improving efficiency, accuracy, and economic benefit through a network of physical objects such as devices, vehicles, buildings, and other items—embedded with electronics, software, sensors, and network connectivity that enables these objects to collect and exchange information with one another. (Internet of Things)
146. Market Share Analysis – Optimizing the locations of facilities so the allocated demand is maximized in the presence of competitors using tools like location-allocation in ArcGIS. (Location-Allocation Tool)
147. Nearest Location – Resolving the nearest gas station, restaurant, or coffee shop using GPS-based positioning and geocoded business data.
148. Property Appraisal – Appraising residential properties using Census data and finding your property online through interactive property assessment viewers.
149. Internet Geocoding – Mapping and analyzing user-generated geocoded data to get a glimpse of what internet users (in the aggregate) think about particular places. (Geocoding)
150. Geocoding Businesses – Pinpointing anything to everything from restaurants, banks, and donut shops with a list of addresses.
151. Reverse Geocoding – Geocoding in reverse; taking locations from a map and listing their addresses.
152. Daytime Population – Marketing products effectively with detailed daytime population demographics for an area reflecting who works in that area as opposed to residential demographics.
153. Local Advertising – Advertising through social, local, and mobile mediums through location and making presence more known.
154. Tax Havens – Sheltering tax through tax havens then putting it all on a map. (Open Corporates)
155. GeoBranding – Increasing credibility and increasing sales with prospective clients, vendors, and media by conveying complex data to increase sales.
156. Desire Lines – Plotting desire lines showing stores that serve customers. (Origin and Destination – QGIS Oursins Plugin)
157. Commercial Establishments – Updating commercial establishment using gvSIG Mobile and local databases. (Commercial Establishment Database)
158. Supply Chain – Finding which supply chains are vulnerable to better plan for interruptions (Boundless Supply Chain)
159. Integrated Freight Network Model – Integrating highly detailed information about shipping costs, transfer costs, traffic volumes, and network interconnectivity properties in a GIS-based platform. (Integrated Freight Network Model)
160. Capital Projects – Listing all the capital projects with different stages of completion.
161. Gravity Models – Determining the likelihood of customers patronizing a particular store based on the store’s proximity, competition, and other factors.
162. Employee Travel Times – Modelling travel times in urban networks for employee travel times.
163. Store Openings – Historicizing a company’s store openings. (IKEA Store Openings)
164. Foursquare – Recommending 50 million users search for restaurants, recommend bars, and check in around the world with a Mapbox custom branded map. (Foursquare)
165. Infrastructure Expansion – Comparing historical data to current conditions with satellite data from Astro Digital.
Consumer Behavior

166. Data Analytics – Analyzing location-based information to reveal the relationship between individuals, families, and communities, and the environment in which they live.
167. Huff Model – Calculating sales potential based on the Huff Model – an interaction model measuring the probabilities of consumers at each origin location patronizing a new store instead of other stores. (Huff Gravity Model)
168. Consumer Profiling – Optimizing consumer profiling with location-based information on age, ethnicity, education, housing, and more. (GeoEnrichment)
169. Retail Customer Segmentation – Segmenting markets by customer prototypes to improve the effectiveness of campaigns. (Esri Tapestry Segmentation)
170. Buying Behavior – Correlating unthinkable variables like weather and location with buying behaviors to find sales opportunities.
171. Retail Store Movement – Detailing how customers move through retail stores, what they bought, rejected, and looked at.
172. Real-Time Gas Prices – Crowdsourcing gas price updates at various gas stations on or along a route. (Waze Crowdsourced Gas Prices)
173. Store Placement – Guiding the placement of new stores by studying disposable income, population, or other variables to best serve the population.
Climate Change

174. NASA Earth Observatory – Exploring the causes and effects of climate change on our atmosphere, oceans, land, and life through the use of satellite data. (NASA Earth Observatory)
175. Climate Change Skeptics – Turning skeptics into believers. Maps make climate change findings easier for skeptics to understand and accept. (Climate Viewer)
176. Earth Interactions – Modelling vegetation, atmospheric, rainfall, and ecosystems to study their interactions simultaneously
177. Sea Level Rise – Collecting data to study sea level rise and climate change from the Jason-3 satellite. (Climate Central)
178. County Climate – See for yourself how the average maximum temperature rises/falls in each county in the United States. (County Climate)
179. Desertification – Understanding the underlying causes of desertification such as inappropriate agriculture practices, deforestation, and drought.
180. Land Surface Temperature Change – Using map algebra to see how land surface temperature changes year by year. (Land Surface Temperature)
181. Piecing Together the Climate Change Puzzle – Combining various climate change data sets from various sources – for example relating land practices with atmospheric aerosols. (ArcGIS Online)
182. Pollution Modelling – Mapping air pollution sources and impacts on the environment and people.
183. Google Planetary Engine – Seeing with your own two eyes the alarming changes on our planet. (Google Planetary Engine)
184. Bird Risk and Richness – Studying the effects of shrinking habitats on bird populations in the world. (Audubon)
185. Carbon Sequestration – Deferring global warming through carbon sequestration through location-based carbon management systems.
186. Köppen-Geiger Climate Classification – Modelling observed and projected climate change scenarios with variables such as population growth, economic development, and varying energy use and technological innovations.
187. Smog – Squinting your eyes to see through all of that smog.
188. Temperature Change – Measuring the effects of greenhouse gases as the main culprit of temperature change by mapping temperature at levels above the Earth’s surface.
189. Climate Change Design – Redesigning to accommodate climate change and pinpointing those locations needed most.
190. Land Change Modeller – Simplifying innovative land planning and decision support with IDRISI’s Land Change Modeler. It includes special tools for the assessment of REDD (Reducing Emissions from Deforestation and Forest Degradation) climate change mitigation strategies.
191. Vegetation Indices – Using remote sensing vegetation indices like NDVI, CTVI, NRVI, and PVI to monitor vegetation change throughout time.
Crime

192. Crime Patterns – Responding to crimes with a data-driven approach and delivering tailored responses through rapid deployment of personnel and resources. (Spillman CompStat)
193. Incident Map – Keeping the community safer by streaming visual mediums for arson, assault, burglary, homicide, prostitution, robbery, theft, and vandalism in a city.
194. Auto Theft and Recovery – Tracking auto theft with GPS-enabled vehicles.
195. Sex Offenders – Tracking past criminal offenders with GPS movement patterns in relationship to schools and other entities.
196. Emergency Calls and Dispatch – An emergency call starts and ends at a location. GIS can manage both 911 calls and dispatching units to precise locations. (Zetron Computer-Aided Dispatch)
197. Law Enforcement Operations – Allocating and dispatching police officers where it’s needed most by studying crime activities.
198. Unlawful Landlords – Capturing thermal signatures of illegal tenants in sheds because renting out sheds is illegal in London, England.
199. Predictive Policing – Patrolling Mapping clusters of burglaries or other crimes assigning more police in those locations using heat maps or Getis-Ord General G and point patterns.
200. Missing Body Search – Narrowing down the search for a missing by finding subtle terrain anomalies in the ground using LiDAR.
201. Megan’s Law – Obeying the requirement for local law enforcement agencies to notify residents about the presence of certain sex offenders in their area by only contacting a buffered area of the offender’s residence.
202. Forensic GIS – Applying science and geographic information for the investigating of a crime – such as using GPS-recorded information in vehicles to prove the location at the scene of a crime. (Forensic GIS – The Role of Geospatial Technologies for Investigating Crime and Providing Evidence)
203. GeoEvent Notification – Avoiding high-crime areas with geofencing when delivering high-valued goods.
204. Extra Penalties – Dishing out extra penalties to criminals if convicted of selling drugs within a specified distance of school property.
205. Illegal Smuggling – Monitoring cross-border smuggling activity by placing a GPS on a vehicle with a warrant to do so.
206. Fear of Crime – Interviewing individuals for fear of crime using GPS-enabled mobile computing.
207. Geographic Profiling – Using a connected series of crimes to determine the most probabilistic location of a criminal offender or offense which is useful for finding serial criminals.
208. Stalking – Abusing GPS technology by stalking with a GPS receiver. A GPS jammer prevents positional monitoring.
209. First Response – Getting to a crime scene quicker with all the critical information needed in the field. (Adashi Incident Command Software)
210. Traffic Violations – Collecting and mapping traffic incidents to assess if units should be spread out or concentrated in certain locations.
211. Open Air Drug Markets – Uncovering the relationship between crimes and the location of open-air drug markets based on analogous crimes throughout other communities
212. Ankle Monitor – Homing in on those under house arrest or parole. GPS bracelets only have value if you know where they are going.
Defense

213. Augmented Reality Sandtable (ARES) – Improving battlespace and military visualization with projected GIS data on a sand table. (Augmented Reality)
214. Terrorism Search – Finding Osama Bin Laden using remote sensing imagery with biogeographic theory (distance-decay theory and island biogeography theory). (Finding Osama Bin Laden)
215. Anti-aircraft – Answering anti-aircraft gun reach using 3D dome layers to avoid dangerous airspace (Anti-aircraft)
216. Safe Landings– Parachuting from the skies safely by evaluating the underlying surroundings of the area.
217. Intelligence Data Integration – Overlaying accurate geographic data for battlefield application and making life-saving decisions
218. Combat Flight Planning Software (CFPS) – Previewing combat routes, weapon delivery, and airdrop planning in Falcon View. (Falcon View)
219. Reconnaissance Satellites – Spying on enemies with satellites – from Corona in 1959 to the tiny CubeSat being used today.
220. Base Construction Planning – Constructing a base site without it being visible from nearby major roads using the 3D skyline tool.
221. GEOINT – Revealing human activity through the use of geospatial investigation and ultraviolet to microwave imagery.
222. Military Simulation – Simulating ground vehicles in a highly realistic virtual world.
223. US Army Corps of Engineers – Delivering vital public and military engineering services keeping geospatial information in mind. (US Army Corps of Engineers)
224. Pigeon Mapping – Spying on enemies in World War II with the Bavarian Pigeon Corps – a flock of pigeons equipped with cameras.
225. Chokepoint – Safeguarding chokepoints like bridges or dams where critical infrastructure converges – explosions here would cause multiple effects.
226. Bird Strike – Flying safely through the Bird Avoidance Model (BAM) – a temporal raster grid equal to the sum of the mean bird mass for all species present.
227. Uranium Depletion – Mapping depleted uranium and preventing it from getting into the wrong hands.
228. President Assassination – Preventing assassinations by understanding the logistics of a past one.
229. Mobile Command Modeling – Setting up shop by finding the most optimal mobile command location.
230. Common Operating Picture – Getting everyone on the same page with a Common Operating Picture.
231. Military Mission Planning – Increasing operational awareness to helicopter pilots through 3D for conducting ingress and egress movement.
232. Locational Intelligence – Creating safety and danger areas for ground-to-ground weapons (Surface Danger Zones) and air-to-ground Weapon Danger Zone.
233. United Nations Peacekeeping – Employing the necessary humanitarian aid and developing peace in war-torn countries.
234. Critical Features – Identifying threats to homeland security by collecting knowledge of the built and cultural environments.
235. Tactical Planning – Deploying troops and military equipment to combat zones intelligently by searching compressed and quick-loading reconnaissance imagery.
236. Motion Video – Capturing georeferenced video to assess anything such as the operational status of an industrial plant, bomb damage on a target, or length of a runway. (GeoMedia Motion Video Analyst)
237. Homeland Security – Addressing vulnerabilities and formulating preparedness measures in case of terrorism and emergency situations.
238. Virtual Reality – Simulating military and training in a 3D environment using GIS data.
239. Attack Modelling – Modeling a potential attack to legitimize the needs and have policymakers truly understand the consequences of an attack with preparedness expenditures.
240. Helicopter Landing – Inventorying potential landing zones for helicopters unseen, unheard, and on flat terrain.
241. Guard Posting – Posting armed guards in optimal locations to eliminate chokepoints.
242. 3D Fences – Building security fences with post-interval and a number of wires/boards with heights in a 3D GIS environment.
243. War Maps – Familiarizing oneself with the enemy defenses and territory by mapping strategic attacks.
244. World Trade Center – Responding to terrorist attacks including real-time data delivery, victim tracking, facility and resource vulnerability, data availability, implementation, environmental exposure, and air monitoring (World Trade Center GIS Response)
245. Georeferenced Video – Cataloging and retrieving full motion video using the ArcGIS Full Motion Video Add-In or Hexagon Geospatial GeoMedia Motion GeoVideo Analyst.
246. Detecting IED – Monitoring disturbed surfaces one day to the next to find Improvised Explosive Devices
247. Logistics – Responding to military and security decisions with timely logistics and support.
248. Camouflage Detection – Carrying out early reconnaissance missions during a war using near-infrared.
249. Military Grid Reference System – Locating points on the Earth in three parts – grid zone designator, square identifier, and numerical locations.
Disaster

250. Richter Scale – Depicting earthquakes on a 3D globe like spikes on a porcupine for each reading on the Richter scale.
251. Shared Operations – Responding to disasters with quickness and reliability using a Common Operating Picture and cloud services (Cloud GIS for Disaster Monitoring)
252. Chernobyl Exclusion Zone – Buffering a radius of 18.6 miles (30 km) which is now known as the Chernobyl Exclusion Zone.
253. Landslide Vulnerability – Dodging landslides with relief maps and 3D analysis.
254. Hurricane Response – Sidestepping the threat of hurricanes by tracking historical hurricane paths and through better disaster response/assistance.
255. Earthquake Prediction – Obtaining earthquake signatures measuring subduction events with GRACE satellite and the geoid. (Earthquake Prediction)
256. Coastal Surges – Estimating risk in three steps using HAZUS software by FEMA.
257. Citizen Alert – Guaranteeing protection of citizens by delivering geo-targeted alerts on mobile. (FME Server Real-Time Earthquake Reporting)
258. What-if Scenarios – Determining higher likelihood events based on historical data and spatial analysis.
259. Evacuation – Evaluating evacuation capabilities neighborhoods may face and generating effective design.
260. Oil Spill – Degreasing oil spills by identifying the current direction and rate of oil movement.
261. Tornado Warning Siren – Safeguarding residents with effective siren coverage in tornado alley. (Tornado Warning Siren Modelling)
262. Fire Severity – Prioritizing prevention and planning efforts during forest fires.
263. Flood Forecasting – Simulating with stream discharge hydrographs with variations of water over time.
264. Tornado Alley – Finding patterns of historical tornadoes in Tornado Alley.
265. Avalanche Modeling – Uncovering areas prone to avalanches by assessing high slopes with sparse vegetation for residential planning, ski resorts, and highway safety planning.
266. Tsunami Damage – Identifying high-risk areas for tsunami damage
267. Emergency Shelter – Allocating emergency shelter at the time of disaster
268. Consequences Assessment Tool Set (CATS) – Analyzing damage to the environment and providing real-time resource allocation information to mitigate the consequences. (Leidos Consequences Assessment Tool Set)
269. Vulnerability to Natural Hazards – Deselecting hazard-prone land for more resilient communities through smart land planning.
270. Search and Rescue – Rescuing missing people by using small, highly maneuverable unmanned aerial vehicles (drones).
271. Volcanic Ash – Rendering volcanic ash clouds in 3D for their dispersion of spillages underwater.
272. Earthquake Epicenter/Hypocenter – Establishing the epicenter, hypocenters, faults and lineaments, radius, and frequency of earthquakes.
273. Volcano Activity – Monitoring thermal emission from the volcano’s summit in Iceland using Landsat’s Thermal Infrared.
274. Disaster Warning – Alerting citizens before a large-scale earthquake happens with a new generation of inter-operable early warning systems for multiple hazards. (DEWS – Distant Early Warning System for Tsunamis – uDig)
275. Earthquake Assistance – Assisting in the aftermath of the massive Ecuador earthquake by listing “Safe Place” locations from government listings. (Waze Community Assistance)
276. Disaster Debris – Estimating debris amounts to better prepare and respond to a major debris generating event.
277. Earthquake-Landslide Susceptibility – Mapping the susceptibility of earthquake-induced landslides using artificial neural networks and factors such as slope, aspect, curvature, and distance from drainage. (Earthquake-Landslide Susceptibility Using Neural Networks)
Ecology

278. Telemetry – Collecting GPS locations from collared mammals for storing, displaying, and analyzing their coordinates.
279. Habitat Suitability – Factoring in all the variables to understand the habitat that animals select and avoid using linear regression.
280. Land Facet Corridor Analysis – Identifying linkages between wildlife and landscapes. (Land Facet Corridor Analysis)
281. Landscape Fragmentation Tools (LFT) – Classifying land cover types into forest fragmentation categories – patch, edge, perforated, and core. (Landscape Fragmentation Tools LFT)
282. Migration Patterns – Simulating the East African wildebeest migration patterns for the Serengeti–Mara ecosystem in East Africa.
283. Path Metrics – Calculates turn angles, step lengths, bearings, and time intervals for a point time series dataset using GME.
284. DNA Traits – Mapping the richness, distribution, and diversity of organisms on the landscape based on a molecular marker (DNA).
285. Surui Tribe – Equipping the Surui tribe with geo-tagging equipment to put an end to the deforestation and cultural devastation in their section of the Brazilian rainforest. (Surui Tribe)
286. Species Biodiversity – Gauging over time a decrease in biodiversity or an abundance of species (invasive or disturbance-increasing) using temporal GIS. (Refractions Biodiversity BC)
287. Honey Bees – Stimulating spatial thinking processes by analyzing relationships between environmental characteristics and honey bee health and abundance (GIS Honey Bee Research)
288. Elk Ranges – Estimating an average home range for an entire herd of mammals using the Minimum Convex Polygon in Hawth’s Tools.
289. Anthropogenic Disturbances – Understanding the effects of transmission line construction by monitoring mammals with helicopter surveys. Get to the choppa!
290. Migratory Birds – Cross-referencing telemetry GPS migratory (Osprey) bird locations with Langley Air Force Base flying operations to reduce an aircraft strike. (NASA Langley Research – Bird/Wildlife Aircraft Strike Hazard)
291. Shannon’s H Diversity Index – Measuring mathematically species diversity and richness in a community.
292. Microclimates – Analyzing exposure to sunlight with aspect data as an indication of microclimates and species occurrence.
293. Topographic Ruggedness Index – Estimating terrain heterogeneity which is useful for predicting which habitats are used by species
294. De-Extinction – Bringing extinct species back to life and marking their previous habitats – like the passenger pigeon from 5 billion birds to zero in a couple of decades.
295. Sky View – Maximizing the portion of visible sky and understanding potential forest habitat.
296. FragStats – Computing a wide variety of landscape metrics for categorical map patterns.
297. Topographic Position Index – Classifying the landscape into slope position and land-form category
298. Global Ecology Land Units – Characterizing distinct physical environments and associated land cover of global ecosystems (USGS). (Global Ecology Land Units)
299. Biogeography – Studying ecosystems in geographic space and through (geological) time along geographic gradients of latitude, elevation, isolation, and habitat area.
300. Species Modelling – Running the Maximum Entropy Model (MAXENT). (QGIS Species Distribution Modelling (QSDM) plugin)
301. Flocking Birds – Mimicking flocking birds in a system of interactive parts using Agent Based Modeling. (NetLogo Flocking Birds)
302. Risk of Extinction – Describing existing conditions of habitat and predicting risk of extinctions, the chance of recovery, and mitigation measures – such as prohibiting hunting.
303. Habitat Priority Planner – Prioritizing conservation, restoration, and planning through NOAA’s Habitat Priority Planner. (Habitat Priority Planner)
304. DNA Barcoding – Attaching a specific location when barcoding life. Smithsonian Institution National Museum of Natural History – (DNA Barcoding – Natural History)
305. Society for Conservation GIS (SCGIS) – Assisting conservationists worldwide through community involvement and for the conservation of natural resources and cultural heritage. (SCGIS)
306. Sanctuary Ecologically Significant Areas – Delineating remarkable, representative, and/or sensitive marine habitats, communities, and ecological processes as SESAs. (Sanctuary Ecological Significant Areas)
307. Mammal Magnetic Alignment – Discovering how deer can sense magnetism through satellite image analysis and field observations of body alignments of deer beds in snow. (Proceedings of the National Academy of Sciences 2008)
308. Sustainable Populations Counts – Counting polar bears and their geographic distribution by analyzing two satellite images over time.
309. Crocodile Eggs – Monitoring in real-time factors like temperature and humidity for crocodile eggs. (Crocodile Eggs Real-Time Monitoring)
310. Into the Okavango – Trekking the Okavango in a journal style map – the world’s last great wetland wildernesses and UNESCO World Heritage Site.
311. World Animal Protection – Becoming more resilient to future disasters. (World Animal Protection)
312. Linear Directional Mean – Determining the trend for the movement of elk and moose in a stream valley could calculate the directional trend of migration routes for the two species.
313. Wa-Tor Predator-Prey Simulation – Simulating ecological predator-prey populations with randomness and rule-based responses.
314. Golden Eagle Tracking – Tracking Golden eagle populations using a Biodiversity Tracking System in Manifold GIS.
315. Earth Trends Modeler – Assessing long-term climate trends, measuring seasonal trends in phenology, and decomposing image time series to seek recurrent patterns in space and time in IDRISI TerraSet.
316. Ecological Barrier – Marking physically isolated barriers between species.
317. Geotagging Photos – Specifying wildlife photo locations through geotagging and streamlining the importing process with ArcPhoto.
Economics

318. Spatial Econometrics – Intersecting spatial analysis with economics. (GeoDa)
319. World Economic Outlook – Projecting the future economy and key macroeconomic indicators with the World Economic Outlook – IMF (World Economic Outlook)
320. Goods Flow – Illustrating the flow of people or goods from point to point based on values with desire lines.
321. Globalization – Measuring the degree and extent of economic globalization using international trade data through time.
322. The Thünen Model – Distributing the production themselves in space incorporating costs of transport and factor mobility.
323. Economic Freedom – Mapping economic freedom throughout the world – an annual guide published by The Wall Street Journal and The Heritage Foundation.
324. Geographic Portfolio – Diversifying your stock portfolio geographically for different countries and stock markets of the world.
325. Global Trade – Exporting goods that start at one location and end up in another.
326. Geographic Innovation Index – Investigating the relations between geographic proximity to innovation resources and stock returns. (Geographic Innovation Index)
327. Economic Base Indicator – Viewing economic indicators for business, industry, and demography based on radial, drive, and proximity.
328. Thematic Mapping – Portraying economic data like unemployment and labor information in time-series thematic maps because maps speak to people
329. Exclusive Economic Zone (EEZ) – Carving out boundaries for sovereign rights regarding the exploration of marine resources below the surface of the sea
330. Gross Domestic Product – Creating continuous area cartograms. (Cartogram QGIS Plugin)
331. Global Transition to a New Economy – Prioritizing human well-being through a crowd-sourced sustainable projects map. (Global Transition to a New Economy)
332. Trade Area – Delineating the geographic area where a certain percentage of a store’s customers live.
333. Economic Costs of Pollution – Assessing greener growth options and the costs of pollution in India by understanding the current state of environmental degradation.
Education

334. Campus Navigation – Navigate through a university campus with online mapping applications.
335. Neogeography – Opening the floodgates for individuals to create their own maps, on their own terms and by combining elements of an existing toolset
336. Projection Art – Investigating our Earth by understanding map projections.
337. Macroscope – Seeing through the macroscope – our earth as a whole rather than be taken apart in its constituents. (Macroscope)
338. Bus Services – Assessing which addresses in proximity to a school are eligible for busing.
339. Safe Routes to School Mapping Toolkit – Deciding the safest route to school.
340. Geospatial Revolution – Captivating audiences with the Penn State Geospatial Revolution
341. Cartographic Modelling – Using map algebra to depict the relationships of transportation and geography on access to adult literacy centers in Philadelphia.
Energy

342. Nuclear Power Risk – Conceptualizing nuclear power plant radioactive release with evacuation time and population exposed.
343. Marine Renewable Energy – Seeing the ocean of information with wave heights and wind for electric dam selection.
344. Concession – Putting concession licenses that give a company the right to drill for oil or gas and exploratory drilling boreholes on a map.
345. World Power Types – Seeing how much of the world is being powered by fossil fuels, nuclear and renewable sources. (What Powers the World?)
346. Nuclear Waste Site Selection – Safeguarding people with proper nuclear waste disposal
347. Water Yields and Scarcity – Estimating water yields and scarcity at a sub-watershed level to calculate hydroelectric potential to the year 2100. Water Scarcity with Ecosystem Services Modeler IDRISI – The Ecosystem Services Modeler (ESM)
348. Access Limitation – Calculating access limitations for building like slope being a major factor for getting wagons up the hill to the site.
349. Coal Stockpiles – Capturing satellite imagery of frequent shots of open pit mines and resource stockpiles to better understand how much coal has been mined each month. (Coal Stockpiles)
350. Shale Gas Plays – Depicting current and prospective shale gas resource areas in shale basins from the Energy Information Association.
351. Dam Sites Selection – Comparing hypothetical dam sites by potential water storage to understand how land use/land cover is impacted.
352. Energy Consumption – Drawing out energy capacity and consumption on a map. (World Energy Consumption Map)
353. Wind Farm Site Selection – Selecting suitable wind farms by understanding wind power, transmission capacity, road access, and developable land.
354. Turbine Visibility – Discerning visibility of wind for potential changes on a landscape, such as the effects of adding wind farms, or the addition of a new building to an urban area.
355. Radar Interference – Calculating potential radar interference and conflicts between turbines and airport approach/landing surfaces with 3D analysis.
Engineering

356. Asset Management – Managing infrastructure data maintenance along with their lifecycle.
357. Building Permits – Helping the user determine whether or not a requested permit is in a historic district, an aquifer protection district, wetland, or floodplain.
358. CAD Interoperability – Integrating CAD data (DWG, DXF) into GIS and vice versa.
359. Construction Environmental Management Plan – Mitigating the potential negative impacts of engineering projects by identifying environmentally sensitive sites and mitigation measures.
360. COGO – Constructing points, spirals, curves, and arcs with coordinate geometry.
361. Real-time Sensors – Monitoring carbon monoxide in real-time with GeoEvent Extension with set thresholds and alerts (Valarm Monitoring Company)
362. Augmented Reality – Pulling up engineering diagrams and real-time sensor networks to view water pressure or amperage. (Augmented Reality)
363. Cut & Fill – Carving out 3D cut and fills for major civil engineering projects such as major road constructions.
364. Department of Interior – Constructing dams, power plants, and canals for protecting water and water-related resources in the United States. (Bureau of Reclamation)
365. Facility Management – Optimizing energy efficiency with building automation services for a more comprehensive view of a building.
366. Artificial Dam – Damming a site artificially by raising the elevations along a dam site using a Euclidean distance grid and map algebra.
367. Development Area – Getting the big picture by tapping into GIS data like gentle slopes, and closeness to roads.
Environment

368. Environmental Impact Assessment – Measuring anticipated effects on the environment of a proposed development project
369. Site Remediation – Removing contamination from a plot of land detailing risk exposure and an overview with maps.
370. Fire Growth Simulation – Extinguishing fires faster by understanding how they grow in discrete steps bringing together wind, weather, and fuel for the fire. (FireScience BehavePlus)
371. Surface Water Flow – Characterizing water flow to be identified as a high consequence for oil spill mitigation.
372. Dead Zones – Mapping out dead zones where marine life is unable to be supported.
373. Canadian Land Inventory – Charting out the land capability to sustain agriculture, forestry, and recreation.
374. Non-point Source Pollution – Modelling non-point source pollution like soil erosion and sedimentation which are often controlled by variables such as land use/cover, topography, soils, and rainfall.
375. Wetland Inventory – Delineating wetlands by types and function. (National Wetlands Inventory)
376. Invasive Species Modular Dispersal – Modelling the spread of a species’ population distribution through time occupancy maps (GRASS GIS Species Dispersal)
377. Storm Water Runoff – Conserving nearby resources such as water and flora by better managing runoff.
378. Brownfield and Greenfield Sites – Digging up the background information (Phase 1) and conducting the necessary geotechnical analyses to explore economic opportunities at brownfield and greenfield sites.
379. Ozone – Motivating the world to do its part by mapping the spatial distribution of ozone concentrations.
380. SWAT Model – Testing the effectiveness of agriculture and environmental policies for pollution control systems in a given watershed like the mwSWAT Plugin in MapWindow
381. Karst – Identifying known cave and karst resources into a sinkhole digitization database for best interstate alignment selection. (Karst Database)
382. Permafrost – Interpreting permafrost probability in the Yukon.
383. Traffic Sign Deterioration – Assessing the effects of air pollutants on traffic sign deterioration. (Traffic Sign Deterioration)
384. Impoundment Index Tool for Wetlands – Unearthing wetlands with Impoundment Index Tool to site potential wetland restoration projects, monitor wetland drainage, and model beaver habitat.
Forestry

385. Forest Inventory – Prioritizing timber harvesting units by referring to age class and forest type to better measure timber acreage and average estimates.
386. Forest Fires – Plotting out forest fires with MODIS. (University of Maryland Forest Fires)
387. Deforestation – Gauging deforestation using land cover change in time.
388. Reforestation – Recharging forests through tree planting planning on a map.
389. Forest Heights – Measuring tree heights with altimetry and noticing how trees generally differ 20m with taller ones at the equator. (GLAS Satellite)
390. Vertical Point Profile – Viewing the vertical profile of 3D LiDAR points to better understand tree structure and height. (TNT LiDAR)
391. Cut Lines – Finding cut lines in ortho imagery to find easy access.
392. Tree Lines – Drawing tree lines in the Canadian Arctic.
393. Illegal Logging – Identify potential illegal activity with satellite data. (Global Forest Watch)
394. Forest Carbon Reserves – Sequestering carbon through forest reserves and carbon observed in the atmosphere.
395. Agent-Based Simulation – Simulating the spread of an agent (like a fire) triggered by random events (such as lightning) on a raster landscape in discrete time.
396. Global Forest Watch – Putting all the pieces together with an integrated forest watch online platform.
397. Drones for Indonesia Indigenous – Promoting sustainable forests using drones in Setulang village, Indonesia. (Drones for Indonesia)
398. Wildfire Rescue – Saving lives through real-time wildfire satellite monitoring.
399. Vegetation Potential – Analyzing tree growth & distribution of vegetation with west/east-facing and aspect data.
400. Leaf Area Index – Summing the total area of leaves per ground unit.
401. Amazon Rain Forest – Maximizing satellite potential viewing soil erosion, watershed destabilization, climate degradation, and species extinction in Brazil.
402. Remnant Rain Forest – Studying aspect data to find how remnants of rainforest are almost always found on east-facing slopes (with aspect) which are protected from the dry westerly wind.
403. 4D GIS – Getting to know the XYZ’s with timber harvesting and subsequent vegetation growth.
404. Age of Trees – Inventorying the XY position and rings of trees in a database to understand their age.
405. Forest Disease – Mapping the impact of how forest infestations like the mountain pine beetle have on forests and the economy. (Google Fusion Tables – Disease Map)
406. Wildfire Simulation – Automating the spread of wildfire in time using the 3D virtual workspace of Capaware.
Gaming

407. Oculus Rift – Building realistic 3D environments with Esri CityEngine because virtual reality is all about location and a sense of place. (Esri CityEngine and Oculus Rift)
408. Building Virtual Environments – Designing future buildings, roads, cities, and parks with video game contributions. (GIS and Gaming – Matt Artz)
409. Geoguessr – Embarking on an educational journey that takes you all over the world (Geoguessr)
410. Mercator Projection Game – Learning about the shape, size, and conformity of the Earth with map projections.
411. Spatial Data Integration – Intersecting the gaming world with rich, real-world, spatial data integration.
412. Planet Hunters – Finding undiscovered planets with crowd-source-style online games. (Planet Hunters)
Gardening

413. Living Plant Collection – Managing garden collections and plant records with the ArcGIS Public Garden Data Model like the UC Davis Arboretum, Arnold Arboretum at Harvard University, and Smithsonian Garden. (Public Gardens GIS)
414. Gardening Microclimates – Studying microclimates (temperature from large bodies of water, topography, urban areas trapping heat) to carefully choose and position their plants and make them thrive.
415. Information Delivery – Inspire and educate your visitors with intelligent web maps of your park or garden.
416. Weeds – Storing weeds and herbicide dosage in a database to manage effectiveness and control measures.
417. Roof Gardening – Assessing average temperatures by zoning, water availability, and position sheltering to identify buildings with the greatest potential for rooftop gardens.
418. Garden Reporting – Creating data-driven reports and mapbooks on collections of plants about conditions and hazards.
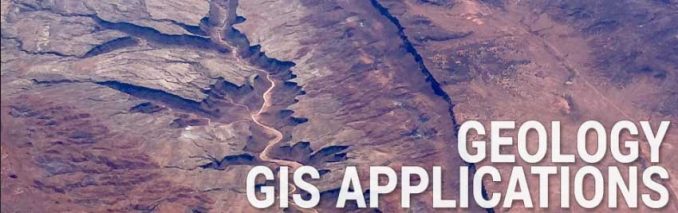
Geology
419. Drill Hole Planner – Drilling with 3D planning tools including depth, azimuth and positions.
420. Aquifer Recharge – Determining potential aquifer recharge using steepness of slope and soil permeability
421. Well & Volumetric Data Visualization – Creating powerful, fast, customized 3D models with a fusion of geologic data, GIS data, well/borehole data, and point cloud data. (Voxler Golden Software)
422. Plate Wizard Project – Reconstructing converging and diverging plates through geologic time.
423. Geological Interpretation – Digitizing surficial geology (surface sediments, their morphology and properties) with air photo interpretation and field validation.
424. qgSurf – Interpreting geomorphological analyses based on their surface and orientation.
425. Marine Geology – Inventorying marine geology. (NOAA Marine Geology)
426. Geomorphology Features – Studying the nature and origin of landforms, including relationships to underlying structures and processes of formation.
427. Dip and Strike – Plotting dip and strike readings and their geological orientation with rotational symbols.
428. Digital Rock Engineering – Tunneling underground with attention to existing topography and its surroundings which includes above-ground and underground structures
429. Aeromagnetic Anomalies – Correlating aeromagnetic anomalies with surface geology in a tectonically active region.
430. Continental Drift – Measuring tectonics plate movement with GPS
431. EnterVol Geology – Creating full 3D, volumetric models of geology direct from collected data integrating lithology data with surfaces. (EnterVol Geology)
432. Subsurface Mapping – Mapping the subsurface through well-log data by drillers with standard lithological terms and a classification system
433. Landform Classification – Classifying landforms with qualitative analysis of the surface like summits, passes, convex/concave break lines, crests, and more with gvSIG geomorphology tools.
434. Geologic Structure – Using photogrammetry in inaccessible regions in 2D and 3D cross-sections for geologic structure mapping. (Hexagon Geospatial Photogrammetry)
Geostatistics

435. Spatial Autocorrelation – Testing whether the observed value of a variable at one locality is independent of the values of the variable at neighboring localities. (GeoDa Spatial Autocorrelation)
436. Data Mining – Automating the search for hidden patterns in large databases
437. Spatial Regression – Building spatial regression to models for estimating the relationship between spatial variables. (GeoDa Spatial Regression)
438. Zonal Statistics – Summing, averaging, or finding the range, minimum or maximum in a given range. (Zonal Statistics)
439. Hexagon Tesselation – Defining sampling locations, helping to ensure that all regions within the study area are represented by the sampling results.
440. First Law of Geography – Using Tobler’s First Law of Geography in analysis- “Everything is related to everything else, but near things are more related than distant things.”
441. Semi-variogram – Graphing the variance in measure with the distance between sampled paired locations.
442. Space-Time Cube – Binning data (netCDF) into a cube input and running statistics, trends, and hot spot analyses over time. (ArcGIS Space-Time Cube)
443. Map-ematics – Making math operations in maps like adding, subtracting, multiplying, dividing, exponentiation, root, log, cosine, and differentiation (Map-ematics – Joseph Berry)
444. Kriging – Interpolating unknown measurements using kriging and other techniques.
445. Analytical Hierarchy Process (AHP) – Combining input layers and a table with several factors comparing their comparative weights to calculate a new layer as a linear combination of the input layers.
446. Ordered Weighted Average (OWA) – Calculating the weighted average of a group of layers based on the order of values. (OWA – gvSIG)
447. Fishnet – Creating a fishnet to correlate the coefficient between boating accidents and dams using a fishnet.
448. Geospatial Modelling Environment – Leveraging open source software R as the statistical engine to drive powerful analysis tools in ArcGIS.
449. Principal Components Analysis – Reducing dimensions with Principal Components Analysis. (Principal Component Analysis)
450. Data Visualization in R – Writing each line of code to programmatically create maps (R Data Visualization – Robin Lovelace)
451. Fuzzy Logic – Applying fuzzy logic with degrees of truth because often does not have clearly defined boundaries.
452. Pivot Tables – Generate dynamic pivot tables in QGIS. (QGIS Group Stats Plugin)
453. Monte Carlo Simulation – Modeling spatial phenomena with simulation models.
454. Minkowski Generalization – Determining how complicated objects are with Minkowski fractal dimension (Minkowski–Bouligand dimension QGIS plugin)
455. Map Algebra – Applying local, focal and zonal functions techniques. (“GIS and Cartographic Modeling” by Dana Tomlin)
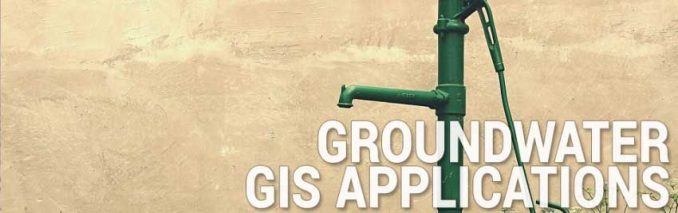
Groundwater
456. Darcy Flow – Examining the movement of groundwater flow through coarse materials like sand.
457. MODFLOW – Modelling groundwater demand and predicting the impact of groundwater demand in basins. (Aquaveo Water Modeling)
458. Groundwater Availability – Analyzing land use practices with water availability and quality.
459. Aquifer Recharge – Measuring permeability recharge and quantifying growth over time.
460. Groundwater Plume – Delineating groundwater contamination and its change.
461. Hydrostratigraphy – Identifying mappable units based on aquifer hydraulic properties.
462. DRASTIC – Evaluating the vulnerability of pollution of groundwater resources based on hydrogeological parameters.
463. 3D Borehole – Symbolizing sub-surface data like boreholes magnitude with inverted depths.
464. Groundwater Volume – Determining to drill a new well by examining existing groundwater and surface water.
465. Stratigraphy – Plotting boreholes, cross sections, and well logs. (Golden Software Strata)
466. Contamination – Evaluating the risk of impact for the construction and situating industrial plants, landfills, agricultural activities, and other potential groundwater contamination sources
467. Porous Puff – Calculating mass per volume of a solute at a discrete point into a vertically mixed aquifer with the ArcGIS Groundwater Tools.
468. Shallow Slope Stability (SHALSTAB) – Computing grid cells that are critical shallow groundwater recharge values.
Health

469. HealthMap – Delivering real-time, global disease monitoring (HealthMap)
470. Centre for Disease Control (CDC) – Serving county-level maps of heart disease and stroke by race/ethnicity, gender, and age group, along with maps of social and economic factors and health services for the entire United States or for a chosen state or territory. (Interactive Atlas of Heart and Stroke)
471. Leukemia Research – Investigating leukemia clusters with proximity to transmission lines.
472. John Snow – Forging a whole new field of study (epidemiology) by studying the spatial distribution of cholera cases and identifying the source of the outbreak as the public water pump on Broad Street.
473. Ebola – Mapping the change of confirmed and probable cases of Ebola over time.
474. Distance to Health Care – Finding the closest doctor is a spatial problem
475. Vital Records – Recording of events, such as births and deaths that are maintained by public health agencies.
476. Lead Concentrations – Correlating how children with lead poisoning were found to be closer to an old lead refinery.
477. Cluster Analysis – Identifying built environmental patterns using cluster analysis and GIS: relationships with walking, cycling, and body mass index. (Cluster Analysis)
478. Euclidean Distance – Finding the distance to disposal sites during an avian flu outbreak.
479. Disease Surveillance – Monitoring West Nile Virus with GIS on handheld devices.
480. Asthma – Connecting the dots between asthma and air pollution.
481. Epidemiology – Tracking disease and epidemiological information in a spatial database. (CDC Epi-Info)
482. UV Exposure – Exposing the risks of harmful UV rays with birth rates.
483. Mobile Flu Shots – Determining an optimal site location for mobile flu shot vehicles to service where demand is needed most with location-allocation.
484. Geomedicine –Tracking patient’s location history to determine if environmental and industrial hazards put them at risk for certain types of diseases
485. Madrid’s Air – Visualization Madrid´s air (gases, particles, pollen, diseases, etc) to make visible the microscopic and invisible agents. (Madrid’s Air Map)
486. Ambulance Response – Responding to emergencies faster with the quickest geographic route.
487. Infant Mortality – Track child immunizations with mortality rates.
488. Food Trust – Overlapping factors like poverty and obesity, fresh supermarkets, diet-related disease – space to target for policy-makers
489. Public Health Informatics – Ensuring patients get the care they need with public health care informatics.
490. Walgreens Prescription Mapping – Mapping and analyzing influenza based on the prescriptions customers are making to respond to the need of users more efficiently.
491. Disease Spread Patterns – Plotting ellipses for a disease outbreak over time to model its spread.
492. Walkability – Piecing together walkable neighborhoods with health diseases like heart disease, hypertension, obesity, and even breast cancer.
493. Anti-Smoking Campaigns – Targeting Anti-smoking campaigns where it’s needed most and most visible to the target audience.
494. Cancer Research – Researching cancer from the sky with the Landsat satellite. (Landsat Cancer Research)
495. Mosquitoes-borne Illness – Identifying areas with high indices of mosquito infestation and interpreting the spatial relationship of these areas with potential larval development sites such as garbage piles and large pools of standing water.
496. HIV AIDS Database – Making the distribution of HIV/AIDS to manage treatment.
497. Tele-medicine – Quantifying populations and health care available for patients and health care providers.
History

498. Shipwrecks – Documenting the remains of shipwrecks, aircraft, hulks, lost anchors, and any other objects on the seabed through the SHIPS Project.
499. American Museum of Natural History – Apply biodiversity information to collect, organize and analyze biological and environmental data to provide new insights into conservation, ecology, and evolution.
500. Topoview Slider Publishing maps with a slider style map to see how an area looked before development and how it changes over time. (USGS Topoview)
501. Micronesian Navigational Chart – Navigating by canoe using stick charts as ocean swell patterns.
502. Historical Photos – Geo-locating historical photos in augmented reality. (WhatWasThere application)
503. Babylonians – Etching the lay of the land on clay.
504. Old Weather – Tracking past ship movements and telling the stories of the people on board by studying weather patterns. (Old Weather)
505. Pilgrimages – Setting foot on a pilgrimage and mapping the distances traveled.
506. Boundary Changes – Carving out how boundaries change in time such as after World War II.
507. Spy Glass – Time-travelling back to 1836 in New York powered by Esri. (Smithsonian Institution)
508. Industrial Revolution Radioactivity – Putting radioactivity on the map since the industrial revolution.
509. 3D Historical Fly-through – Soaring through historical imagery with ArcScene.
510. Smoke Signals – Using viewsheds to put yourself in Native Americans’ shoes when smoke signals were used.
511. Ancestry – Surveying through ancestry with geophylogeny – the evolution and geographic spread of common ancestry and geographic connectedness.
512. ArcGIS Online Historical Maps – Exploring the old USGS historic maps. (USGS Historic Maps)
513. Manhattan Immigration Patterns – Showing how immigrants in Manhattan varied not only through space, but also time. (Past Time, Past Place: GIS For History)
514. Aztec vs Mexican Last Names – Aligning current place names to historical place names to understand the ancient geography of Aztec culture. (Aztec and Mexican Last Names)
515. Witchcraft Accusers – Gathering the geographic location of the accusers and accused during the Salem witch trials to show inter-family feuds were a strong case for the trials instead of hysteria among young girls.
516. Cultural Preservation – Preserving historic properties whose documentation must still be located and entered into this GIS.
517. Pangea – Drawing the different stages of the continental evolution from Pangea to the Earth we see today.
518. Napolean’s March to Moscow in 3D – Visualizing troop movement, cities, base maps, and temperature in time slices using Esri’s CityEngine Napolean’s March to Moscow. (Napolean March in 3D)
519. Georeferencing Historical Imagery – Straightening historical imagery using georeferencing.
520. Human Activity Patterns – Engraving activity on maps showing human movement patterns with time-enabled GIS.
521. Land Bridges – Agreeing on an acceptable term for “land bridge” – which was an area available due to the water tied up in ice sheets.
522. Lewis and Clark – Charting out the Lewis and Clark expedition.
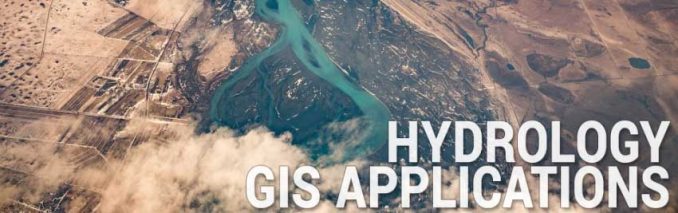
Hydrology
523. Braided Rivers – Managing braided rivers with their complex geometry and state in flux.
524. Sedimentation Rate – Characterizing erosion and sedimentation with the Sediment Transport Index.
525. Catchment Areas – Delineating watershed catchment areas, where rainfall flows into a river.
526. Topographic Wetness Index – Combining slope and upstream area to give you the relative measure of wetness as the first place where the ground saturates, begins to pool, and generates runoff.
527. Flow Direction – Coding the direction of flow with eight valid directions. (Flo 2D)
528. Flow Estimator – Estimating flow rates with a series of spatially-located gauging stations.
529. Height Above River – Generating predictive surfaces for plant species distribution modeling using high-resolution DEM data. (LiDAR Height Above River)
530. Sinuosity – Measuring the degree of channelization and meandering for a given watercourse.
531. Stream Feature Extractor – Extracting stream features (wells, sinks, confluences, etc.) from a stream network. (Stream Feature Extractor QGIS Plugin)
532. Hydrologic Volume – Measuring volumes for the Hydrologic Budget Equation and amount of precipitation in a given watershed.
533. HEC-HMS – Simulating the complete hydrologic processes of dendritic watershed systems with the HEC-HMS GIS-based methodology.
534. Flow Accumulation – Answering the question “where did water come from” by picking a point (a single cell in the DEM) and tracing backward showing all the contributing cells. (TauDEM)
535. SCALGO – Understanding Earth’s hydrology as a function of topography using the SRTM DEM. (SCALGO)
536. GHydraulics – Analyzing water supply networks using EPANET. (Ghydraulics QGIS Plugin)
537. Aqueduct – Mining, modeling, and analyzing water risk with the current and future stresses.
538. Contour Lines – Delineating contour lines because floods follow contour lines.
539. Flood Extents – Digitizing flood extents worth satellite data like synthetic aperture radar.
540. BASINS (Better Assessment Science Integrating point & Non-point Source) – Running water quality assessments with land use, point source discharges, and water supply withdrawals.
541. Crayfish QGIS Plugin – Animating flood model outputs and flood propagation. (TUFLOW)
542. ArcHydro – Operating ArcHydro in ArcMap to delineate and characterize watersheds.
543. Drainage Channel Builder – Cutting a simple, trapezoidal channel in a DEM and calculate cut volumes. (Drainage Channel Builder QGIS Plugin)
544. HEC-RAS Flow Model – Predicting where the water will go (flooding) to prevent inundated roads and inaccessibility. (RiverGIS QGIS Plugin)
545. Horton Statistics – Calculating the number of streams, the average stream length, and the average area of catchments for Strahler stream orders
546. Flow Stations – Marking flow stations on a map.
547. Water Shortage – Modelling water shortage in California
548. Upstream/Downstream – Finding the origin of water from a specific point. (Hydro Hierarchy)
549. MIKE21 – Simulating physical, chemical, or biological processes in coastal or marine areas.
550. Oxbows – Mapping the evolving process of how rivers change in time and become oxbows.
Humanitarian

551. Election Violence – Reporting issues like outbreaks of violence, intimidation, or vote fraud during Tanzania’s election. (Restless Development – What3Words)
552. Ushahidi Haiti Project – Plotting out crisis reports during the Haiti earthquake for humanitarian/tech workers aid with crowdsourcing. (Ushahidi Haiti Project)
553. Humanitarian OpenStreetMap – Responding to humanitarian issues and economic development through open data sharing. (Humanitarian OpenStreetMap)
554. Community Engagement – Harnessing human potential by leveraging open data and civic technology. (Kathmandu’s Living Labs)
555. Kibera Slum – Mapping sites of rape and crime by the people themselves to solve where a police station should be located (and more). (Kibera Slum)
556. Crisis Mapping – Using drones to aid Nepalese in a time of crisis.
557. Food Security – Delivering assistance with expected outputs to those in need most.
558. Humanitarian Assistance – Plotting the spatial distribution of humanitarian assistance for planning purposes.
559. Food Insecurity Drivers – Pinpointing the underlying drivers of food insecurity such as farming practices, climate change, and changing demographics.
Insurance

560. Insurance Risk – Charging higher insurance premiums in flood-prone areas using radar
561. Monitoring Driving Habits – Fastening seat belts and monitoring people’s usage to charge car insurance.
562. Insurance Fraud – Doing the detective work for fraudulent crop insurance claims
563. Floodplain – Minimizing losses by flooding through FEMA flood maps.
564. Real-time Hazard – Using location intelligence to Identify areas of hazard in real-time.
565. Climate Change Risk – Adjusting to climate change with better future risk prediction.
566. Social Media Integrating – Finding all Flickr posts within 100 meters of property during incidents.
567. Sinkholes – Preventing risk by understanding landscape characteristics – such as resulting depressions in a karst landscape.
568. Underwriting – Accelerating underwriting by sharing enterprise geographic data with risk factors, customer interaction, and economic conditions.
569. Swimming Pools – Crowdsourcing the search for swimming pools from sponsored campaigns that compile public and private sector data for a variety of markets including education, public safety, and insurance.
Internet

570. Geoblocking – Limiting your access to the internet, based on your geographic location.
571. Hyperlinking – Embedding hyperlinks with access to actual photos, video, audio, text, and data associated with map locations.
572. Mapzen Search – Searching geographically with a spatial search engine for places based entirely on open-source tools and powered by entirely open data. (Mapzen Search)
573. Geosocial Tools – Searching Twitter geographically for tweets with the gvSIG Geosocial Toolbox.
574. GIS-Based Search Engine – Correlating products and services to a GIS database record that corresponds to a unique geographic location – to geographically target advertising over the Internet (GIS-Based Search Engine)
Land Use Planning

575. Urban Model Development Feasibility – Evaluating multiple land use scenarios; testing and refining transportation plans; producing small-area concept plans, and modeling complex regional issues with Envision Tomorrow (Envision Tomorrow)
576. Land-use Conflict Identification (LUCIS) Model – Making smart land-use decisions with a model-builder framework land-use conflict identification strategy. (Smart Land-Use Analysis: The LUCIS Model)
577. Beijing Building Footprints – Crowd-sourcing digital mapping of Beijing building footprints.
578. Food Deserts – Accessing grocery stores in low-income areas by incorporating information such as sidewalks, bicycle lanes, and public transit.
579. Service Areas – Measuring how far paramedics and firefighters can service an area.
580. Agent-Based Models – Exploring cities using Agent-Based Models and GIS. (GIS Agents)
581. Cloud Computing-Based Land Base Mapping – Bringing land use planning to the cloud for Smart Cities like the City of Portland. (Cloud Computing)
582. OpenStreetMap – Harnessing the power of the OpenStreetMap by downloading the physical data for free (OSM Download)
583. Landfill Site Selection – Analyzing and eliminating sites within a buffer distance of sensitive populations (elderly, schools, hospitals, etc) and other overlay information like groundwater, transportation networks and surface water.
584. TerraClip – Clipping data like you’ve never clipped before – extracting land cover, climate, and agriculture data easily to the extent of your chosen country. (TerraClip)
585. Green Roofs – Greening roofs in metropolitan areas with a focus on lighting and shadow analysis.
586. Stamen Maps – Orienting yourself with Stamen’s terrain maps with hill shading and natural vegetation colors.
587. Cellular Automata – Stimulating urban growth expansion simulation. (IDRISI Cellular Automata)
588. Tax Parcel Viewer – Assembling tax parcels and zoning information with color schemes on a web viewer.
589. Economic Viability – Making decisions on parcels of prime agricultural land using the Analytic Hierarchy Process.
590. Water Distribution – Tracking flow, pressure, and chemical concentrations for nodes, valves, pipes, and tanks in a water distribution modeling software. (EPANET)
591. Commercial Space Availability – Checking zoning data for any city such as commercial space availability.
592. Land Use Policy – Reproducing individual behavior with agent-based modeling to simulate their behaviors and outcomes having a direct impact on the surrounding landscape. (Agent-Based Modeling)
593. City Heating – Addressing the GIS requirements of municipal hot water heating networks in Tatuk GIS (Tatuk GIS- City Heating)
594. Commuter Shed – Finding where the commuter sheds are.
595. Recycling Centres/Drop-offs – Allocating recycling drop-off centers with data integration and quantification and assigning alternatives for vehicle routing.
596. Walkshed – Calculating walking times using Tobler’s hiking function based on slope (QGIS Walking Time Plugin) Walkshed Web GIS
597. 3D Viewshed – Showing what is visible with distance, direction, and pitch with viewable areas in green and hidden areas in red. (3D Viewshed – Geomedia 3D)
598. Anaglyph 3D – Viewing anaglyph 3D images with the SAGA GIS Anaglyph Tool.
599. Land Use Change – Summarizing statistics, graphs, and tables in spatial units
600. Tax Collection – Increasing tax revenue by updating land and building property records, new construction records, and integrated departmental data into a single cadastral information system using Bentley Map.
601. COAST COastal Adaptation to Sea level Rise Tool – Adapting to climate change decisions (building sea walls, proactive building ordinance, levees, zoning change, relocation with COAST. (COAST – Global Mapper)
602. Space Syntax Models – Gaining a better understanding of human behavior and connectivity through a graphic representation of space configuration in urban structures.
603. Philadelphia Redevelopment – Developing urban planning scenarios using a 3D swipe view. (Philadelphia CityEngine)
604. Future Development Patterns – Locating future growth and evaluating scenarios such as loss of prime agricultural land.
605. Land Use – Generating polygons and classification with the multi-resolution segmentation algorithm. (Trimble ECognition)
606. Building Constraints – Prohibiting construction where the overall stability of a bluff using aspect to understand how- south-facing slopes undergo more extensive freeze/thaw cycles.
Mail Services

607. National Addressing – Delivering parcels to a specific address, all speed in a single national database.
608. Natural Area Coding System – Unifying the representations of geographic coordinates, area codes, street addresses, postal codes, map grids, and property identifiers of every location or area in the world.
609. Shared Mailboxes – Spreading mailboxes out to address demand and existing population with algorithms like location-allocation.
610. Amazon Mail Delivery Drone – Shipping parcels in style using drone technology.
611. Non-Address Delivery – Generating addresses for businesses and people without one using a 3×3 meter global grid system.
612. Zip Code Maps – Splicing the nation with geo-located zip/postal codes and Mapping them out.
613. Daily Routing Efficiency – Balancing postal routes based on time and optimizing routes, number of routes, or volume with sequenced stops. (ArcGIS RouteSmart)
614. FedEx Package Tracking – Meeting timelines and managing routes for special types of deliveries.
Media

615. Targeting Advertising – Positioning advertisements for target demographics using census data and the right location.
616. Communicating Stories – Storytelling in news events with maps such as oil spills, crime scenes, and weather damage.
617. Social Media Mapping – Monitoring social media by location.
618. Movie Maps – Creating ultra-realistic 3D cities for big box office movies. (Esri Goes to Hollywood)
619. Bigfoot Field Researchers Network – Finding Bigfoot in a spatial sightings database. (Bigfoot Research)
Municipality/Urban

620. Potholes – Reporting potholes or automatically detecting them with LiDAR for infrastructure management.
621. Asset Management – Reporting infrastructure defects with photos and geo-locations. (City of Portland PDX Reporter App)
622. Smart Cities – Integrating urban development visions with GIS such as smart urban planning, smart utilities, smart transportation, smart public works, and citizen engagement.
623. London in Maps – Charting life in London, England like never before with 100 maps and graphics.
624. 3D Printing Oslo – Printing off 3D models of the City of Oslo with data preparation in FME. (3D Printing of Oslo)
625. Water Main Breaks – Knowing exactly where water lines and shut-off valves are located, prior to work.
626. Lightscape – Lighting up bridges picking out the illuminated details and obscured areas.
627. Curb Cuts – Finding curb cuts that give access to people with disabilities
628. Utility Poles – Inventorying utility poles with important attributes like overhead/underground, number of lines, and date of construction.
629. Waste Collection – Defining areas of waste collection, and finding suitable rounds of service when given a waste or transfer station. (Waste Collection – uDig)
630. Fire Hydrants – Locating hydrants in a municipality marking their general condition, and date for greasing the caps and exercising the valve.
631. Spatial Data Infrastructure – Connecting multiple users in separate departments for managing data, metadata, users, and tools.
632. Insect Control – Spraying pesticides to eliminate mosquitoes and other pests with knowing no-spray zones and the status of the previous spray.
633. Homeless Shelters – Analyzing urban inequalities and homelessness to allocate homeless shelters appropriately.
634. CityScan – Managing city assets (road conditions, utilities, billboards, and sign inventories) with mobile LiDAR to inventory and ensure safety standards.
635. Sewer Network – Design sewer systems and their networks with right-of-way considerations and using the flow by gravity.
636. Advisories – Alerting citizens of boil water advisories by taking an area on a map, and connecting to a central database of phone numbers and automated message alerts.
637. Street Cleaning – Plowing geographic zones of a city.
638. Speed Limits – Defining speed limits in a road network with proper signage.
639. Road Closures – Advising citizens of road closures visually on a map.
640. Emergency Water Supply – Preparing emergency water supply when contaminated. (Ordnance Survey – Geomedia)
641. Cemetery Mapping – Implemented a system to map cemeteries using unmanned aerial vehicles UAVs) and storing graves in a spatial database.
642. Open Information – Reducing the need for telephone operators by having data displayed on a map.
643. Participatory GIS – Gearing towards decision-making from citizen input and geo-spatial technologies.
644. Land for Development – Finding available serviced and unserviced land available for development.
645. Toponymy – Giving each place, park, river, and feature of interest a name.
646. Lift Stations – Move the flow from a lower to a higher elevation for sewer utility.
647. Stormwater Pollution – Measuring stormwater pollution by estimating runoff and sources
648. Seismic Slope Stability – Modelling stability of slopes using geology and digital elevation models to understand the potential of seismically-induced landslide hazards.
649. Water Wells – Developing constraints for water wells such as quality, quantity, stressed aquifers, and contamination for drinking.
650. Real-time Snow Plows – Seeing the grid of snowplows in real-time in a municipal network and GPS.
651. Solid Waste – Picking up after ourselves with geo-referenced garbage collection routes.
Mining

652. Subsurface Volume Calculation – Calculating depth values to determine the volume of material between the surfaces or between a subsurface layer and the ground level with Global Mapper.
653. Quarries – Capturing volumes of fill removal and forecasting future volumes extracted to understand quarry lifespans.
654. Kriging – Using statistical approaches for mining valuation with the geostatistical technique kriging from Daniel Krige.
655. Natural Resources – Mapping out natural resources like uranium, metals, stones, and gemstones. (United States Natural Industrial Resources Map)
656. Mining Operations – Track mining assets in the field with mobile GIS.
657. Coal Exploration – Identifying new opportunities and areas for coal exploration by assessing geological data and setting out exploration targets. (Coal Exploration in GIS)
658. Mine Rehabilitation – Restoring mines back to their original state using GIS tools like 3D profiling flooding of mine because almost all working mines require pumps to remove water.
659. Hazards Assessments – Characterizing infrastructure, risk areas, and disaster zones, planning and implementating of hazards reductions measures to assist planners in selecting mitigation measures and emergency preparedness.
660. Hyperspectral Imagery – Discovering new minerals from the existing 4000 types of compositions using airborne and satellite data. (AVIRIS and AISA Hyperspectral)
661. Mineral Titles – Administering mining titles for exploration and acquisition available on a web map.
662. Diamonds – Searching for diamonds in Nairobi in fluvial diamond placer deposits.
663. Acid Runoff – Controlling acid waste runoff from mines by capturing terrain topography, mine age, and stream proximity.
Nautical

664. Anchor Search – Searching for a lost anchor in a restricted area with electrical cables and gas pipelines using sonar and bathymetry.
665. Open Sea Map – Sailing the big blue watery road with Open Sea Map.
666. Christopher Columbus – Tracing Christopher Columbus’ footsteps on his voyages and discovery of America.
667. Shipping Routes – Stitching together shipping routes using the Satellite-based Automatic Identification Systems.
668. International Waters – Aligning the boundaries of international waters in a georeferenced system.
669. Submarine Routes – Routing twenty thousand leagues under the sea for submarine routes using 3D modeling.
670. Live Marine Traffic – Turning your computer into a marine traffic monitoring station giving the perspective of nearby ships on the ocean. (Live Marine Traffic)
671. Trajectories and Magnitude – Using vectors (U and V) to depict nautical wind speed and direction.
672. Global Trading Ports – Climbing buoys as if you’re at giant marine trading ports – the arteries of our global economy.
673. Nautical Charts – Plotting out the seamless, collarless, and dynamic mosaic of some 2,100 NOAA raster nautical charts at varying scales. (NOAA Nautical Charts Viewer)
Ocean/Marine

674. Pacific Ocean – Opening Google Earth and realizing how the Pacific Ocean covers one side of the Earth in a global view.
675. Underwater Grasses – Diving into the ocean with satellite imagery and delineating their extents.
676. Coastal Hazards – Minimizing loss by identifying potential hazards such as algal blooms, eutrophication, and tsunamis (Coastal Hazards)
677. Ocean Use Planning – Outlining sustainable oceans through careful planning of ocean activity such as energy production, fishing, and shipping. (Planning Ocean Uses – Cindy Fowler)
678. Marine Pollution – Pinpointing the source of marine pollutants such as industrial, agricultural, and residential waste.
679. Algae Blooms – Monitoring algal blooms through multiple images over time.
680. Wave Reduction – Curtailing wave energy by mapping and building up coral reefs and other coastal habitats as a nature-based solution.
681. Deepsea Dawn Wright – Understanding the relationship and patterns of how oceans affect dry land and more. (Ocean Solutions, Earth Solutions)
682. Marine Tools Plugin – Geoprocessing with marine data to better understand research, conservation, and spatial planning problems.
683. Whale Tracker – Studying the movement and migration patterns of whales around the Hawaiian Islands. (Whale Tracker)
684. Underwater Street View – Submarining as if you’re underwater in Google Earth’s underwater street view.
685. Build-Out Design – Developing and designing a build-out project in Grenada.
686. Bathymetry – Exploring ocean bathymetry from an exaggerated 3D global perspective. (Ocean Bathymetry)
687. Rising Sea Levels – Identifying areas of risk as sea levels gradually rise from climate change.
688. Aquaculture – Farming fish in a sustainable manner by understanding where inland fisheries are located. (GISFish)
689. Coastal Management – Adapting to climate change through better flood and erosion defense.
690. Coral Reef Conservation – Understanding the present state of coral reefs through mapping to better understand future deterioration.
691. Energy Budgets – Simulating Earth’s energy budgets for anthropogenic and natural changes with anomalies of surface temperature and sea-level pressure.
692. Coastal and Marine Ecological Classification Standard (CMECS) – Combining water columns, geoform, substrate, and biotic components that are collectively used to define marine ecosystems. (CMECS)
693. Wave Heights – Replicating ocean waves by factoring size, choppiness, and wind. (Wave Heights)
694. Sea the Animals – Tracking turtles, seals, porpoises, and turtles in time-animated web maps. (CartoDB Sea the Animals)
695. Marine Bioregional Plans – Protecting the marine resources by dividing the coasts of Australia into four geographical pieces.
696. General Bathymetric Chart of the Oceans (GEBCO) – Charting out elevation paths along the ocean with GEBCO. (GEBCO)
697. Ocean Salinity – Measuring sea surface salinity from space with Aquarius. (Ocean Salinity)
698. National Marine Sanctuaries – Designating 12 areas of the marine environment as special significance to better understand marine ecosystems and their spatial, temporal, and functional relationships among creatures, environments, and human perturbations. (National Marine Sanctuaries)
699. Ocean Tourism – Getting out your towels and soaking some sun with tourist maps of the ocean.
700. Coastline Fractals – Modelling complex natural shapes along the coastline’s fractal-like (jagged recurring pattern) properties.
Oil/Gas

701. Directional Drilling – Logging depth, inclination, and azimuth (dependent on true and magnetic north) for directional drilling.
702. Active Licenses – Exploring active, operations and exploration wells at all locations on a map.
703. Oil Exploration – Planning and exploring drilling operations using 3D GIS to analyze the data and visually inspect the results.
704. Offshore Production – Mapping oil activity offshore including pipeline, significant oil and gas discoveries, and restricted zones.
705. Pipeline Rupture – Responding to pipeline ruptures to better understand surrounds and impact zones such as privately-owned parcels and critical fume areas.
706. Oil Search – Magnifying the search for resources and extending beyond the core elements (Oil Search – Boundless)
707. Pipeline Route Selection – Optimizing route selection by taking a heuristic approach and multiple layers such as the environment, geo-hazards, and engineering.
708. Geomagnetic Referencing – Using the Earth’s magnetic field obtained by the USGS to more accurately drill direction and position. (Geomagnetic Referencing)
709. Oil Reserves – Measuring how much shadow is being cast of a floating roof’s oil tanks using geometry and high spatial resolution imagery.
710. Undersea Environmental Impacts – Assessing potential impacts of the undersea environment as oil and gas activity increases.
711. Oil Reserves Map – Laying out the top 20 oil-producing countries, with reserves in billions of barrels of oil. (Manifold)
712. Environmental Impact Assessment – Gauging multiple layers including existing infrastructure, river crossings, soils and vegetation, groundwater, and elevation/ slope to determine pipeline impact.
713. gvSIG Viewport – Panning along a linear pipeline corridor in 3D with an overview viewport to know the location in public consultation.
714. Pipeline Infrastructure – Surveying footprints and inventorying pipeline infrastructures like pump stations, tank terminals, and pipelines.
715. Gulf Basin Depositional Synthesis – Providing context for exploration reducing overall risk to oil and gas companies by understanding the depositional history of drilling.
Parks

716. Trail Planning – Valuing cells to pave out a path that accumulates the least ‘cost’ from a source to a destination.
717. GPS Tracking – Applying tracking technologies to humans to understand how their movements affect ecosystems in national parks.
718. Fuzzy Logic – Identifying suitable locations for the construction of parks with relevant experts to determine the significance and weight of the criteria.
719. Biodiversity – Managing biodiversity in parks with smartphones.
720. Noise Map – Mapping sound levels in parks to show how visitors and wildlife interact with each other and park resources.
Politics/Government

721. Redistricting – Encouraging citizen involvement through web-based applications for the redistricting process (Redistricting QGIS Plugin)
722. Voting Patterns – Reviewing how electoral districts voted at the polls.
723. Bosnia-Herzegovina – Dividing a road to peace of the former Yugoslavia at the valley bottom using terrain data to support diplomatic negotiation. (Geospatial Revolution Episode 3)
724. Stewardship of Land – Supporting Native American decision-making through GIS implementation. (Tribal GIS Book – Joseph Kerski)
725. Gerrymandering – Manipulating the geographic boundaries of an electoral constituency to favor one party.
726. Open Data – Opening up government (tax-payer) data through geospatial open data portals and data sharing strategies.
727. Enabling Governments – Saving money by investing in a GIS-based system for decision making.
728. Parcel Fabric – Editing zoning, dissemination areas, and land designation boundaries.
729. Breakaway/Disputed Areas – Delineating international and maritime boundary dispute areas from Kashmir to the Elemi Triangle, Northern Cyprus to Western Sahara (Natural Earth Data)
730. Tax Evaders – Catching tax evaders by recognizing areas of wealth such as swimming pools.
731. Dissolving Political Boundaries – Grouping separated countries into one like West and East Germany as well as North and South Vietnam.
732. International Joint Commission – Solving international watershed issues through international collaboration. (Transboundary Watersheds)
733. National Geospatial Data Asset Management – Managing geospatial data as a capital asset for effective sharing, and collaboration to support efficient and effective decision-making. (FGDC National Geospatial Data Asset Management Plan)
734. Border Safety – Increasing safety at international borders often stretching miles.
Real Estate

735. Buffer Zone Search – Buffering a search area for a query when house hunting.
736. Market Analysis – Expanding businesses through customer profiling, estimating sales potential, and finding available lots.
737. Home Evaluation – Getting a big picture to understand home value including proximity to schools or panoramic view.
738. Parcel Dimensioning – Analyzing a property parcel shape to determine the area and dimensions of each identified parcel.
739. Viewshed – Prospecting viewsheds through observation points remotely when setting property prices.
740. Property Appraisals – Supporting accurate property appraisals
741. Foreclosures – Scoping out the effects of recessions on real estate markets by mapping out foreclosures by neighborhood.
742. Geocoded Real Estate – Fetching geocoded real estate in Germany through a JSON and R.
743. Housing with Mortgages – Charting out occupied houses that have a mortgage or loan. (Housing with Mortgages)
744. Wendy’s Restaurant – Prospecting optimal locations for a Wendy’s restaurant.
745. Domino’s Pizza – Streamlining the planning of Domino franchise territories.
746. Retail Site Selection – Inspecting space usage for available commercial space.
747. Comparative Real Estate Analysis – Comparing value per square meter in map form to see how much the price is for similar properties on the block. (Real Estate Comparative)
748. Wind Farm Noise – Assessing the population and number of affected buildings affected by the noise of a wind farm.
749. High Rise Valuation – Characterizing commercial real estate by its unique age, size, location, and proximity to ensure that the property values are consistent between assessed value and the sales price with Geomedia 3D visualization.
750. Construction – Considering slopes for construction and livability as 15 degrees or less is considered buildable.
751. Home Sharing – Scoping out shared homes and surroundings.
752. Real Estate Metrics – Choosing the right house to buy or build based on the distance to schools, parks, transit stops, and other geospatial metrics.
753. Google Cardboard – Visiting properties in Google Cardboard’s virtual reality experience.
754. Walkability – Understanding health factors like active transportation, bike paths, and walking paths in a neighborhood.
Reporting/News

755. Hurricane Andrew – Comparing geographically which homes fared better from Hurricane Andrew’s destruction because of changes in building code from Steve Doig’s piece that earned him a Pulitzer Prize.
756. North Korea – Mapping how far North Korea’s missile projectiles threaten other nations – previously a buffer – now corrected. (North Korea Missile Extent)
757. GeoJournalism – Assisting journalists to dive into a world of data visualization using geographic data.
758. Geotagged Tweets – Spreading the word to make world headlines from local Missouri and eventually the whole world. (CartoDB Geotagged Tweets)
759. Mapping Conflict – Putting any crisis, destruction, or terror attack on the map.
760. Google News Lab – Storytelling around the globe with Google Maps and Fusion Tables (Google News Lab)
761. Super GIS – Estimating the number of protestors at a Hong Kong rally by obtaining the average density of the crowd and estimating the number of protesters through aerial photo interpretation. (Protestor Estimate – Super GIS)
762. Highway Accidents – Reporting the location of highway accidents on a map
763. Demographics Research – Delving into census information for a deep research news story
764. Ballot Counts – Depicting the spatial distribution of states, districts, and parties that won an election
765. The Financial Times – Utilizing tools like Mapbox to create elegant base maps with all the right details.
Society

766. Thematic Mapping – Thematic mapping of poverty with equal intervals, quantiles, natural breaks, and unique schemes. (“Making Maps Third Edition by John Krygier”)
767. Socio-Economic Data and Application Center (SEDAC) – Serving socioeconomic and Earth science data as an information gateway between the Earth and social sciences focuses on human interactions in the environment. (SEDAC)
768. World Languages – Mapping the world’s languages through social media and micro-blogging platforms. (World Languages)
769. Poverty – Sizing up poverty with the FAO GeoNetwork socio-economic indicators. (FAO GeoNetwork)
770. Hunting Zones – Tracing out hunting zones for cultures around the world.
771. Citizen Engagement – Empowering populations who have little voice in the public arena to change geographic involvement and awareness on a local level. (Ushahidi Public Participation Geographic Information Systems (PPGIS))
772. Needs of Services – Allocating the proper needs and inclusion of marginalized populations.
773. Census – Utilizing decennial TIGER data to support and improve selected demographic and economic studies.
774. World Religions – Mapping the intricate details of religions internationally.
775. Space-time GIS – Comparing scientific practice in the US and in China (Space-Time GIS – Michael F. Goodchild)
776. Center of Population – Centering in on population drift watching its shift in dasymetric mapping. (Population Drift – Joseph Kerski)
777. Earthworks – Downloading data from Stanford including labor supply, sex ratio, and social data. (Earthworks)
778. Gender Inequality – Showing the history of how women are working in the GIS field.
779. Demography – Projecting populations worldwide with a dot density style map.
780. Chart Symbology – Taking advantage of pie charts, line graphs, and bar charts to display socio-economic data by area.
781. Indigenous People – Keeping a record of traditional land use of indigenous people.
782. Public Transportation Availability – Reviewing public transit availability in societies.
783. Population Disaggregation – Estimating per-building population through disaggregation of census blocks
784. Distance Decay – Observing distance-decay between locations of ethnic groups- the further apart they are, the less likely it is that they will interact very much.
785. Refugee Camps – Capturing the movement patterns of refugees through time. (Refugee Patterns)
786. Traditional Knowledge – Preserving cultural beliefs and their associated location in a spatial database.
787. Tapestry Segmentation – Dividing U.S. residential areas into 67 distinctive segments based on their socioeconomic and demographic composition—then further classifies the segments into LifeMode and Urbanization Groups. (Tapestry Segmentation)
788. Migrant Rescue – Improving Humane operations and rescuing migrants through the deployment of emergency water stations on routes known to be used by migrants coming north through our desert. (Migrant Rescue)
789. Prism Maps – Drawing each boundary object as a raised prism, where the height of the prism is relative to the associated data value. (Golden Software Map Viewer)
790. Group Decision Making – Mediating interests and getting valued concerns in the community and society through PGIS.
791. Maori Tribe – Recording, organizing, and making available information about traditional values from Maori elders. (Maori Tribe Elders)
792. Human Mobility – Measuring human mobility using mobile phone records enhanced with GIS data.
793. Graffiti – Studying clusters of graffiti with other factors such as proximity to city constructs such as crossing guards, phone boxes, and electricity boxes.
794. Storytelling with Maps – Harnessing the power of story maps such as understanding the gap between minimum wage and high-income earners. (Income Earning in Maps)
795. Illiteracy in Myanmar – Building literacy in Myanmar and evaluating literacy programs in a GIS database with indicators such as budgeted funds, dropout levels, and available training.
796. Gender Studies – Exploring how transportation infrastructure support mobility access to basic services vital to achieving poverty reduction, gender equality, and sustainable development objectives in Ghana.
797. Child Abuse – Allocating family service facilities to sites where child abuse is more prevalent.
Soils

798. Soil Types – Modelling soil types through Jenny’s model involving climate, organisms, topography, material, and time.
799. Soil Grid – Helping agriculture decision-making with ISRIC’s 1km scale soil property and class maps of the world. (SoilsGrid)
800. Texture Classification – Digging up the dirt on soil texture through the USDA soil texture classification
801. Soil Moisture – Estimating soil moisture from space with the SMAP and SMOS satellites
802. Soil Survey Geographic Database (SSURGO) – Making sense of soil parameters like conductivity in the United States. (USDA SSURGO Database)
803. Water Retention Capacity – Determining water retention capacity for a different type of soils and topographic characteristics.
804. Erosion Reduction Strategy – Identifying erosion hot spots through topography, soil, and land-use characteristics. (Erosion and Sediment Control)
805. Slope Parameters – Developing slope profiles such as convex and concave using 3D profile graphs.
806. Soil Loss Equation – Measuring the average annual soil loss caused by rainfall and associated overland flow as defined by the United States Department of Agriculture.
807. Lead Concentration in Soils – Collecting soil samples and mapping the lead geochemical landscape.
808. LS Factor – Calculating slope length (LS) factor as part of the Universal Soil Loss Equation (USLE) based on slope and specific catchment area.
809. Angle of Repose – Computing the steepest angle (depending on the material) of a surface at which loose material such as soil will remain in place rather than sliding or crumbling.
810. Salinity – Inspecting salinity with electromagnetic surveys to find the electrical conductivity in soils and interpolating the results to find unknowns.
811. Peaks and Summits – Detecting peaks and summits on a landscape to help model salinity with elevation such as depression areas have a higher salinity. (Landserf)
812. Vegetation Erosion – Finding the dominant vegetation types dependent on aspect and enhancing erosion modeling using aspect and vegetation to see how slopes will erode over time along with precipitation, temperature, and growing periods.
813. Stereoscopy Tools – Creating stereo pairs from two aerial photographs with anaglyph and virtual-z mode. (PurVIEW)
814. Normalized Difference Soil Index (NDSI) – Gauging soil water content from space using shortwave infrared, near infrared wavelength, and NDSI.
Sports/Recreation

815. Strava Heat Map – Heating up the road with over 375 billion data points showing you exactly which routes other cyclists are taking. (Strava Bicycle Routes)
816. Fitbit – Plugging in your Fitbit to map your runs.
817. Tennis Analytics – Dominating your tennis opponent with in-depth spatial analytics. (Tennis Analytics)
818. Ski Hill – Creating vicious triple black diamond ski runs using the steepest path.
819. Hiking Trail – Incorporating factors in trail development like gentle slopes for an accumulated least-cost path.
820. Optimal Road Trip – Planning a road trip of the century across the United States using the shortest route for all major landmarks.
821. Golf Course Water Systems – Planning a golf course’s underground water system and sprinkler system in 3D.
822. Rollercoaster – Creating realistic a fly-through from interpolated paths using 3D animation capability in ArcGIS Pro. (Rollercoaster Animation)
823. Heli-skiing – Assessing the impacts of heli-skiing on mountain animal behavior using GPS trackers and frequently skiing areas.
824. Stadium Security – Getting the big picture by giving police and emergency responders to track activities on a web-based geospatial platform.
825. Mountaineering – Climbing steep slopes in Google Street View.
826. Surf Breaks – Sizing up wave heights from satellite radar altimeters in orbit. (GlobWave Project)
827. Marathon Routing – Planning the route of a marathon using elevation and base maps.
828. 3D Ski Maps – Touring a mountain virtually in realistic 3D virtual tours. (3D Ski Maps in Golden Software)
829. Football Stadiums – Turn maps into straight line journeys with FME’s ShortestPathFinder transformer. (Football Stadiums Journeys)
830. Google Earth Elevation Transect – Pulling out steep slopes using the elevation transect tool in Google Earth for any given cycling and jogging route.
831. Geocaching – Hunting for treasures and even surveying monuments through geocaching.
832. Swisstopo – Sculpting beautiful topography maps in 3D. (SwissTopo)
833. Fishing Maps – Creating 3D bathymetric maps in real-time with Sonar (Navionics)
834. Ride Sharing – Providing optimal and dynamic ride sharing in urban areas.
835. Mapbox Outdoors – Powering your fitness and outdoor applications with terrain maps that highlight thousands of biking, hiking, and running trails as well as ascents through topography lines.
836. Sports Stadiums – Viewing complex geometries like sports stadiums in 3D. (Vizitown QGIS 3D Plugin)
Surveying/Geodesy
837. Coordinate Calculator – Converting coordinate conversion tool of choice for GIS. (Geography Calculator – Global Mapper)
838. Fibre Optic Cable Design – Extracting LiDAR ground points to assist in fiber optic cable design at water crossings.
839. Tissot Circles – Characterizing distortion from map projections (Indicatrix Mapper QGIS Plugin)
840. Global Positioning Systems – Locating the position of anything and anywhere on Earth.
841. Ordnance Survey – Drafting out maps as one of the largest producers of maps in the World. (Ordnance Survey)
842. Equator Bulge – Measuring the bulge of Earth at the equator
843. Bearings – Importing bearings and distances from a survey for parcel mapping and transcribing it on a map.
844. Triangulation – Using trigonometry to measure the angles in a triangle formed by three survey control points
845. Shuttle Radar Topographic Mission (SRTM) – Obtaining a global digital elevation model from InSAR.
846. Geodetic National Adjustment – Adjusting datum positions with the Geodetic National Adjustment.
Telecommunications

847. Radio-Wave Propagation – Estimating the propagation of radio waves for a network with complex reflections and diffraction and line-of-sight.
848. Locating Cell Towers – Locating cell tower placements in urban areas using 3D building structures.
849. Network Management – Managing a network of telecommunication cables and towers in a network data set.
850. Fresnel Zones – Finding the region of space between wireless transmitter and receiver where obstructions cause interference to the signal.
851. Antenna Height Optimization – Optimizing antenna height using GIS 3D modeling.
852. Operations Support Systems (OSS) – Ensuring that network functions properly including outages, billing, and testing through GIS shared services.
853. Submarine Cable – Sketching out submarine cables that stretch across oceans. (Submarine Cable Map)
854. Network Signal Interpolation – Clustering geographically high and low network signals and interpolating results in cellular signal maps
855. Cellular Coverage Analysis – Maximizing cellular coverage using tower height by using interference analysis including viewshed and line-of-sight.
856. Frequency Management – Regulating radio spectrum to evaluate frequency interactions when approving applications using terrain, environment, and building data. (Spectrum Regulation)
857. Fibre Optic Cable – Planning fiber optic cable infrastructure through network views showing capacity, equipment, and customer demographics.
858. Market Segmentation – Segmenting customers geographically and forecasting the demand for services where growth is likely to occur.
859. Operations – Investigating interruptions in service and managing repair and maintenance work with the Autodesk Topobase infrastructure model. (LIWEST and AutoCAD 3D)
860. Signal Expansion – Planning expansion by better understanding signal strengths in three-dimensional buildings – or mapping your home Wi-Fi signal in 2D.
Tourism

861. Personality Atlas – Assigning personality stereotypes to countries around the world based on a sample size of the global population’s perspectives.
862. Tourist Map – Plotting out landmarks in tourist maps.
863. Sunrise and Sunset – Finding the perfect sunrise and sunset at any given location. (SunCalc)
864. Subway Map – Simplifying maps for the reader to better understand such as the lines of a subway map in high contrasting colors.
865. Linear Referencing – Using linear referencing along shorelines to track volumes of organic debris.
866. Off-Beaten Tracks – Finding the off-beaten track for backpackers and marking its position with 3 words.
867. Safe Travel – Advising travelers where unsafe locations are on a map.
868. Tourism Dollars – Tracking the exports of purchased goods and services using desire lines.
869. Sustainable Tourism Planning – Identifying conflicting interests in tourism and solving issues by examining suitable locations for proposed developments.
870. Hotel Search – Searching geographically for five-star hotels using a circle radius.
871. Horizon Blockage – Calculating the horizon blocking line in all directions from a given observation point with gvSIG’s Horizon Blockage.
872. Travel Mode Detection – Detecting travel mode (walk, car, bus, subway, and commuter rail) from a multi-modal transportation network using GIS and GPS in New York City.
873. Finding Islands – Using satellites to find uninhabited islands around the world – Landsat found Landsat Island near the coast of Canada.
874. Time Zones – Representing time zones around the world.
875. Eco-Tourism Site Selection – Gauging environmental impacts for sustainable eco-tourism sites.
876. Virtual Travel – Seeing your destination before physically being there. (Google Earth Street View)
877. Geo-tagging – Discover places with 360 panoramic camera views. (Mapillary)
878. Highway Planning – Constructing viewpoints with multiple layers like ecology, topography, and cultural features for a three-dimensional visual highway.
879. Virtual Arctic – Exploring the Arctic in Google Street View without getting out of your chair.
880. 3D Synthetic Scene – Overlaying synthetic scenes over the real scene. (Manifold)
881. Life Travels – Accompanying travelers in their life travels in map-form. (Where in the World is Andrew?)
882. Yellowstone – Putting all the pieces together in a GIS database at Yellowstone National Park including its geologic past, geyser recharge, and seismic activity.
883. Trip Planning – Adventuring around for your next road trip with pit stops and offbeat using suggested sites.
884. Observer Points – Calculating visibility through multiple observer points.
885. Historic Street View – Time-travelling in the past to see just how much a location has changed over time with a historic street view.
Transmission

886. Corridor Analyst – Identifying possible corridors and preferred transmission routes using Least Cost Path engineering, environment, and combined routing algorithms.
887. Transmission Line Monitoring – Monitoring overhead transmission towers with active and passive satellite data.
888. Viewshed – Understanding the impacts of how a transmission line would look using viewsheds.
889. Right-of-way – Buffering proposed transmission lines which will be areas cleared for the transmission line.
890. Transmission Line Design – Considering slope, soils, and land use for factoring into transmission line design.
891. Tree Encroachment – Reducing the risk of falling trees with LiDAR in search of dead and dying trees near utility lines.
892. Public Consultation – Visualizing the transmission line with towers in public using 2D and 3D environments.
893. Line Vision – Synchronizing 2D viewing in 3D environments with viewports. (gvSIG 3D Plugin)
894. 3D Geometry – Sketching up custom 3D transmission towers and lines for import into ArcScene. (Google SketchUp and COLLADA)
895. Line Profile – Utilizing slope profiles to generate terrain profiles with Manifold GIS.
896. Environmental Monitoring – Referencing environmentally sensitive sites along a linear transmission system.
897. Map Automation – Generating maps automatically from tiles along a transmission corridor with ArcGIS Data Driven Pages or QGIS Atlas.
Transportation

898. Travelling Salesman – Constructing efficient journeys that visit any number of points on a network in no particular order. (Travelling Salesman)
899. Hadoop – Leveraging the Hadoop framework for millions of data points with big data spatial analytics. (Hadoop Framework)
900. Deadliest Roads – Pinpointing the safest and deadliest roads on the planet with the Roads Kills Map. Spoiler: the Dominican Republic has the most dangerous roads. (Roads Kill Map)
901. Multimodal – Getting cars off the road for multi-modal options by studying cycling paths and walkability.
902. Turn Restrictions – Adding restrictions to U-turns in a network dataset. (TNT Network Analysis)
903. Parking Demand – Estimating parking demand and its fit with parking capacity with Python. (PARKFIT)
904. A/B Testing – Making real-world choices by sending cars to various routes for the fastest deliveries. (Spatial A/B Testing)
905. Closest Facility – Solving the cost of traveling between incidents and facilities which are nearest to one another.
906. Infrastructure Damage – Reporting damaged infrastructure in a browser web mapping system.
907. Motor Vehicle Collisions – Correlating motor vehicle collisions with spatial attributes such as speed limits, guardrails, and on-street parking.
908. Intersection Analysis – Improving intersection safety through crash and road safety analysis with the MapWindow Safety Software Plugin.
909. Intelligent Transportation System (ITS) – Feeding data from GPS units, video cameras, and road monitoring units to advance the efficiency and safety of transportation systems.
910. Shortest Path – Generating the shortest, fastest, or least-costly route between any number of origins and any number of destinations, with any number of intermediate points. (Shortest Path)
911. Vessel Tracking – Plotting automatic identification system (AIS) points on a map in real-time.
912. Network Travel Costs – Determining travel costs from each origin to all destinations
913. Road Asset Management – Using ground survey data showing assets on a roadway in Manifold GIS.
914. UPS Parcel Delivery – Seeing every driver in near-real-time to study the safety and find shorter routes – saving time, tire tread, and costs.
915. Floating Car Systems – Displaying taxi fleet in one hour.
916. Logistics Management – Planning, implementing, and controlling the efficient effective flow and storage of goods and services from a point of origin to point of consumption.
917. Street Repair – Inventorying and reporting repairs on streets.
918. Road Assessment – Taking measurements of pavement through aerial and mobile LiDAR.
919. Trip Generation/Production – Estimating the number of trips that are produced or originate in each zone of a study area. (TransCAD Trip Generation and Production)
920. Railways – Tying railways together with CartoDB’s railway map – from cargo to passenger trains. (Railroads – A Staple for Growth)
921. Service Areas – Identifying service areas from a fixed point along a network route to show response coverage for emergency vehicles.
922. OD Cost Matrix – Improving coordination amongst transportation providers when given multiple origins and multiple destinations.
923. Paratransit – Accessing rides through address entry and buffering points to find nearest routes.
924. World Traffic – Helping drivers get to destinations efficiently with traffic conditions around the world. (World Traffic Map)
925. Transportation Master Plan – Planning future highways and roads by looking at the growth of communities and traffic demand.
926. Airline Planning – Navigating to safer airspace by including nearby land use to runway lighting systems.
927. Routing Workers – Optimizing routes by seeing overlap which saves fuel costs.
928. Traffic Ways – Seeing the world as only traffic ways. (Traffic Ways)
929. Carpooling – Adding carpool lots by analyzing the number of incoming trips in a city.
930. Bus Route – Designing transit routes with cost and demographic impacts.
931. Active Transportation Planning – Leveraging the public with Participatory Geographic Information Systems and active transportation
932. Conflation – Conflating two road datasets with OpenJump Vivid extension “Road Mapper” or Spatial Adjustment in ArcGIS.
933. Infrastructure Life Cycle – Reiterating the process of planning, designing, constructing, operating, and maintaining a transportation system.
934. Inter-modal Transportation – Compiling two different modes of transportation (such as rail and truck) to move goods or passengers.
935. Rails-to-Trails Conservancy – Converting unused railways into paved multi-use paths. (Rails-to-Trails)
936. Traffic Congestion – Alleviating traffic congestion by making the best possible use of the existing transportation network and gathering data to improve decisions for modifying the network.
937. Sidewalk Inventory – Storing sidewalk data in a database with attributes like width, surface type, and clearing priority.
938. Transit Ridership – Collecting statistics on how many passengers ride transit in a given neighborhood.
939. National Bridge Inventory – Making a repository of bridges in a national-wide database.
940. UPS Telematics – Monitor performance and safety of package cars Safety including seatbelt usage, speed, and whether or not a door was shut.
941. Urban Traffic Air Pollution – Recording urban traffic air pollution and quality through 3D visualization in planar and non-planar views.
942. Multi-Criteria Decision Analysis – Selecting highway routes using multiple criteria. (Multi-criteria Decision Analysis QGIS Plugin)
943. Walkability – Mapping out hot spots and cold spots with walkability and kernel density.
944. Bike Sharing – Optimizing locations of bike-sharing program stations.
Utilities

945. Billing Systems – Updating and correcting the billing system for the cost of street and security lighting. (Spatial Billing Systems)
946. Network Management – Visualizing complex spatial webs of utility networks as the foundation to manage the lifecycle of network assets for utilities. (GE Smallworld)
947. Emergency Repairs – Flagging potential emergencies with weather forecasts, staging support where needed, and logistics for the movement of people.
948. Underground Utilities – Penetrating the ground with radar for precise locations of underground gas, water, electrical, and telephone utilities.
949. Pole Inventory – Pinning down with GPS accuracy utility poles.
950. Power Distribution – Figuring out which distribution line could take down an entire network.
951. Vegetation Encroachment – Overlaying LiDAR data with transmission to see where and how much vegetation is encroaching
952. Subsurface 3D Utility Model – Viewing underground utilities in 3D.
953. Lifecycle Management – Updating life cycle status of utility information as existing or proposed in GE SmallWorld
954. Permafrost – Assessing the impacts of permafrost freezing and thawing on utility lines.
955. Utility Pole Replacement – Obtaining all the information when replacing utility poles and other business operations (Asset ID, construction date, overhead/underground conductor, and conductors it supports with the number of wire and cable segments
956. Power Outages – Helping customers keep the lights on with assets and attributes such as poles and transformers in AutoCAD Map 3D.
957. Cost Path – Laying out a gas pipeline from one location to another location with a CAD schematic in AutoCAD 3D.
958. Energy Usage – Mapping trends of electricity usage that are metered to a network.
959. Smart Grids – Determining optimal locations for smart grid and real-time analytic components.
960. Infrastructure Design – Planning network infrastructure, build, operations, and maintenance with Smallworld Core.
961. Energy Demand Estimation – Combining building volume, number of floors and other characteristics to predict the energy demand for heating and cooling using 3D city models in Germany. (Energy Demand Estimates)
962. Schematics – Representing a complex utility network in a simple schematics diagram with ArcGIS Schematics.
963. Street View Measure – Examining utility operations in street view and measuring distances (MM Plugin in ArcGIS)
964. Line Extension Easements – Creating electrical line extension easements (legal rights of access) in GE SmallWorld Electric Office Geospatial Asset Management
965. Cloud Computing – Building and sharing maps in the cloud for common operating and faster decision-making.
Volunteer

966. GIS Corps – Volunteering in GIS projects such as bridging the divide between the world’s insurance markets and the most vulnerable, low-income people. (GIS Corps)
967. National Geographic Society – Preserving and protecting our planet as a global non-profit organization funding hundreds of projects each year. (National Geographic Society)
968. Urban and Regional Information Systems Association (URISA) – Solving challenges in local and national governments through GIS and other information technologies. (URISA)
969. Wikimapia – Describing the world in online, editable maps and mashups with free data available for you to experiment with and create unique applications. (Wikimapia)
970. OpenStreetMap – Establishing open information as a free, editable map through volunteered input.
971. Open Geospatial Consortium – Making quality open standards for the global geospatial community. (Open Geospatial Consortium)
972. USGS Earth Explorer – Opening up satellite data to the world for free. (USGS Earth Explorer)
973. NASA World Wind – Monitoring weather patterns, visualizing cities and terrain, tracking the movement of planes, vehicles, and ships, analyzing geospatial data, and educating people about the Earth with the cross-platform, Java-based NASA World Wind. (NASA World Wind)
974. Open Source Geospatial Foundation (OSGeo) – Supporting the collaborative development of open source geospatial software, and promoting its widespread use. (OSGeo)
975. ArcGIS Open Data – Exploring tens of thousands of data sets around the world from thousands of organizations around the world. (ArcGIS Open Data)
976. Real-Time Collaboration – Collaborating in OpenStreetMap with multiple user entries. (Real-time Collaboration)
977. Natural Earth – Producing public domain data with beautiful cartography layers.
978. Volunteered Geographic Information (VGI) – Harnessing tools to create, assemble, and disseminate geographic data provided voluntarily by individuals (Citizens as Sensors – Goodchild, 2007)
979. QGIS – Pioneering the #1 option for open GIS software. (QGIS Founder – Gary Sherman)
Weather

980. Real-time Lightning – Capturing real-time lightning strikes in a map with monitoring stations located around the world. (Real-time Lightning)
981. Global Wind Vectors – Displaying gusting winds with vectors as directions. (Global Wind – Null School)
982. Albedo – Measuring albedo for Earth’s heat budget using surface reflectance satellite data – bright areas reflect more than dark areas.
983. Solar Irradiance – Harnessing the power of solar energy with the Global Horizontal Solar Irradiance. (Global Horizontal Irradiance)
984. Night-Day Boundary – Illustrating which parts of the Earth people are fast asleep and are wide awake with the night-day boundary map. (Night-Day Boundary)
985. Rainfall – Illustrating rainfall in NOAA’s National Weather Service web map.
986. NASA Ocean Color – Downloading chlorophyll-a concentrations and sea surfaces temperature data sets for studying the increasing risk from ocean acidification and hypoxia. (NASA Ocean Color)
987. Historical Weather – Discerning weather patterns by studying old weather. (Old Weather)
988. Temperature – Mapping out the temperature with multi-dimensional NetCDF which includes dimensions of latitude, longitude, altitude, and time. (NASA Temperature NetCDF)
989. Snowfall – Knowing how much snowfall occurred where.
990. Azimuth – Calculating solar elevation, solar azimuth, and sun hours in the sky for each location (R.Sun – GRASS GIS)
991. Weather Anomalies – Tracking weather events in a spatial database such as snow in the Sahara desert of southern Algeria.
992. 3D Snow Depths – Plotting out 3D snow depths at ski resorts using Golden Software. (Snow Depth Map)
993. Pacific Ocean Blob – Mapping the extent of “The Blob” – an anomalous body having sea surface temperature much above the normal.
994. 3D Atmospheric Data – Visualizing layers of the atmospheric features like a vertical profile.
995. Ocean Surface Current Analysis Real-time (OSCAR) – Delivering near real-time global ocean surface currents. (OSCAR Data)
996. Weather Warnings – Feeding out live warnings with physical locations from National Weather Service. (Weather Warnings)
997. Historical Precipitation – Observing historical precipitation from ground stations and radar in NetCDF with MapWindow Meteobase.
998. Cirrus Clouds – Detecting cirrus clouds with Landsat’s Cirrus band.
999. Hovmoller Diagrams – Plotting meteorological data with latitude and longitude as an axis.
1000. Doppler Radar – Predicting rainfall using Doppler Radar.
1001. Sky View Factor – Considering the visible sky and topographic influences to estimate radiation balances, temperature, and evapotranspiration.
1002. Weather Stations – Obtaining the latitude and longitude positions of weather stations around the world.
Now it’s your turn. What’s Next?
We have shown that GIS is a powerful tool that finds a home in almost every discipline around the globe. Millions of decisions are being powered by GIS.
Needless to say:
In everyday life, there is a lot riding on GIS for spatial decision-making.
A great man once said:
You don’t fully understand your data until you see how it relates to other things.
How do YOU use GIS? What are some spatial decisions that YOU make every day?
Comment below. Let me know.


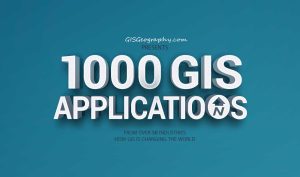
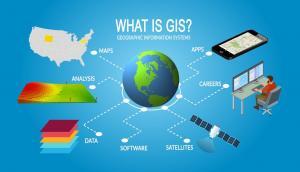

Asset management
This is very informative, many thanks!
This is a fantastic one. Thank you
Muy interesante, gracias por la informacion.
Good job! Thank you very much!
And now, we could pay more attention to another dimension of the world– the digital world. To explore human behavior in virtual world with IOT and GeoAI tools would reveal another wonderful world, I think.
Thanks for sharing
This is beautiful. Thanks for putting all this info together. The world needs more people like you. Great inspiration. I heard this podcast about mapping whale sounds and how they are passed from a source place to whales 100s of miles away.
It will really change the world with the huge efforts of USA, UK and the rest of the world.
This is a really useful mind jogger when trying to present potential use cases in developing countries – would be great to have a few more case studies from outside US and UK.
Excellent! Thank you very much.
I need a PDF copy of this document
@Abedek, I work with various organizations to help them leverage the power of GIS in their specific domain. I think GIS could help organizations such as yours to identify raw materials, the best route to ship them and also in identifying other production areas that you may not know of. Ping me and we can talk more. I think it will be a very interesting conversation.
Great job
Great job! I think the list gives a lot of useful information to many people.
Good work. Any GIS applications in urban sprawl, please?
I work with am organization saddled with the responsibility of developing and promoting the utilization of local raw materials in a third world country. I would like to get suggestions on possible areas of GIS application. It must be noted that access to spatial data is limited which pose a great challenge.
I work with am organization saddled with the responsibility of developing and promoting the utilization of local raw materials in a third world country. I would like to get suggestions on possible areas of GIS application. It must be noted that access to spatial data is limited which pose a great challenge.
I’m an apprentice surveyor, my research just led me here
to have a look at this impressive, well-done job. This list really have motivated me to love survey as regards GIS more and more
Wow this is amazing you have opened my mind to the limitless use of my geospatial skills. The GIS community will one day take over the world. Thank you
Can the GEOFENCE be mobile and control a fifty yard radius communicating the locations of tagged animals in my sanctuary?
Thanks, I referred to your para.5 in my recent Ant/Arctic project
Thanks Andrew!
Great resource, well done !
Is there nothing currently for modelling to distribution and flow of ocean plastics ?
Wow, that list is really impressive!
Our company works with people in municipality and city governments and what you’ve listed under that section covers a lot of what they do: asset management, curb cuts, utility poles, waste collection, fire hydrants, speed limits, road closures, potholes… A lot of this in the broader agenda of building smart cities and harnessing open information and participatory GIS which you have also pointed out.
One specific application that you haven’t mentioned here is using data derived from street-level imagery to do asset inventories. We’ve been particularly working with customers who apply this for traffic sign inventories. So considering your list – it’s wider than speed limits, and an alternative method to CityScan that uses LIDAR. Our customers have taught us that street-level photos offer considerable competition to LIDAR, while being more accessible. A lot of them are peeking at Google Street View or snapping their own photos in order to speed up the process.
If interested – we just published a blog post about 3 trends in using street-level photos for traffic sign inventories based on what we’ve learnt from people in the GIS space: http://blog.mapillary.com/tech/2017/03/02/traffic-sign-inventory-with-street-level-photos.html.
Would be really interesting to hear what you think of this application case.
This is a really neat GIS application. Thanks for the contribution
Very well done…Great information to share with the GIS community around the globe.
Great list. Scores of quality GIS apps available at – https://livingatlas.arcgis.com
#64 isn’t archaeology….
That’s true, I guess it’s paleontology.
I suggest adding the National Land Cover Database from MRLC.gov, National Fish Habitat Partnership 2010 and 2015 fish habitat assessment (great for data already attributed and aggregated for stream networks) @ fishhabitat.org, US Census for TIGER line files (railroads, pipelines, roads, cencus tracts, population, demographics), CCAP -Coastal Change Analysis Program (higher resolution and updated more frequently than National Land Cover Database) for coastal land cover focusing on wetlands, STATSGO for Soil metrics, EPA enviro atlas for Water withdrawal information.
You’ve done a great job of showing the importance of GIS in the world and the workplace!
Thank you so much for the information. Hopefully the rest of the world will realize the importance!
Outstanding list and job! GIS applications are everywhere and quickly increasing around the world! Congratulations!
Excellent job of creating this list. Very useful.
Nice job! Organization is the key to success! Thank you!
Very interesting list. I’ve got stuff to spend the rest of the year studying! Very cool! Congratulations!
I missed some programs too … As GeoDMA, TerraAmazon, TerraHIDRO and other apps INPE… obviously it’s almost impossible to address all apps, so it’s just a memory or accretion to the list … Thank you!