Linear Referencing Systems (LRS)
Linear referencing systems store relative positions on an existing line feature. Unlike regular line geometry, linear referencing systems have m-values, which stands for “measurement”.
It considers how far down a linear feature is relative to a point of reference. Once you have a route, events can be layered on top for different types of linear analysis.
Linear referencing uses relative positions along linear features, such as roads or rivers, to store, analyze, and retrieve location-based information along those features.
How Do Linear Referencing Systems (LRS) Work?
Linear referencing systems use m-values for each vertex, storing them as the relative distance along the route. Events are linear or continuous point features along a route.
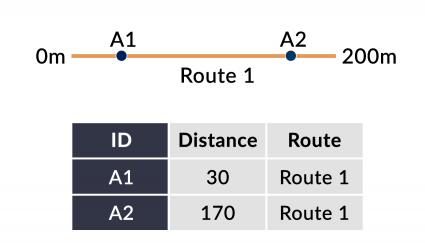
Point Event Layer
For example, this route has two separate point events. First, it references a relative distance of 30 meters from the start point. Next, the second event is at a relative distance of 170 meters.
Line Event Layer
This linear referencing system contains line events, instead of points (as you can see in the table below).
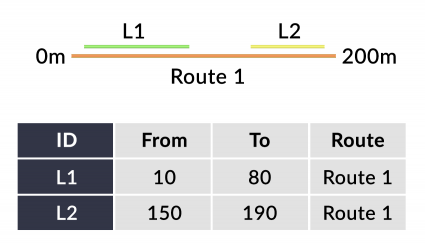
The first event is from 10 meters to 80 meters from the starting point. Then, the second event is from 150 to 190 meters relative to the starting point.
LRS Applications and Uses
Linear referencing applies to various types of spatial phenomena with a linear flow. For example, we use it for roads, rivers, utilities, pipelines, and sewer networks.
The main benefit is that you get measured linear features. So if you’re working with roads, your roads turn into measured lines. If you give directions like “travel 50 meters from milepost 8”, linear referencing works in this relative type of system.
This is why the US Department of Transportation is trying to move to a linear referenced data model with its ARNOLD System[1].

Linear Referencing in ArcGIS
Here are some of the common tools and functionality that you work with when working with LRS systems.
CREATE ROUTE TOOL – If you want to use linear referencing, you first have to create a route. The aim of this tool is to create an m-enabled route from a polyline. You can also set the start point of your route by choosing the coordinate priority as the upper right to the clockwise direction.
ADD ROUTE EVENTS – The purpose of this tool is to relate a route with events. For example, the table can segment your route into intervals to analyze the linear property.
- “From_Measure” field – Start distance
- “To_Measure” field – End distance
There can also be multiple event records if you want more than one event. This is good if you want to segment your route and break it into intervals with multiple start and end measurements.
It’s also necessary to have your data in a projected coordinate system, instead of a geographic reference system. You want to work in units such as meters so you can measure distances, instead of degrees/minutes/seconds (DMS) or decimal degrees (DD).


