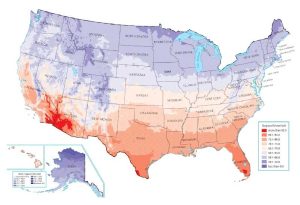
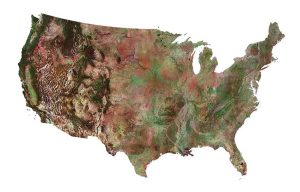
US Precipitation Map
You are free to use our North America time zone map for educational and commercial uses. Attribution is required. How to attribute?
About the map
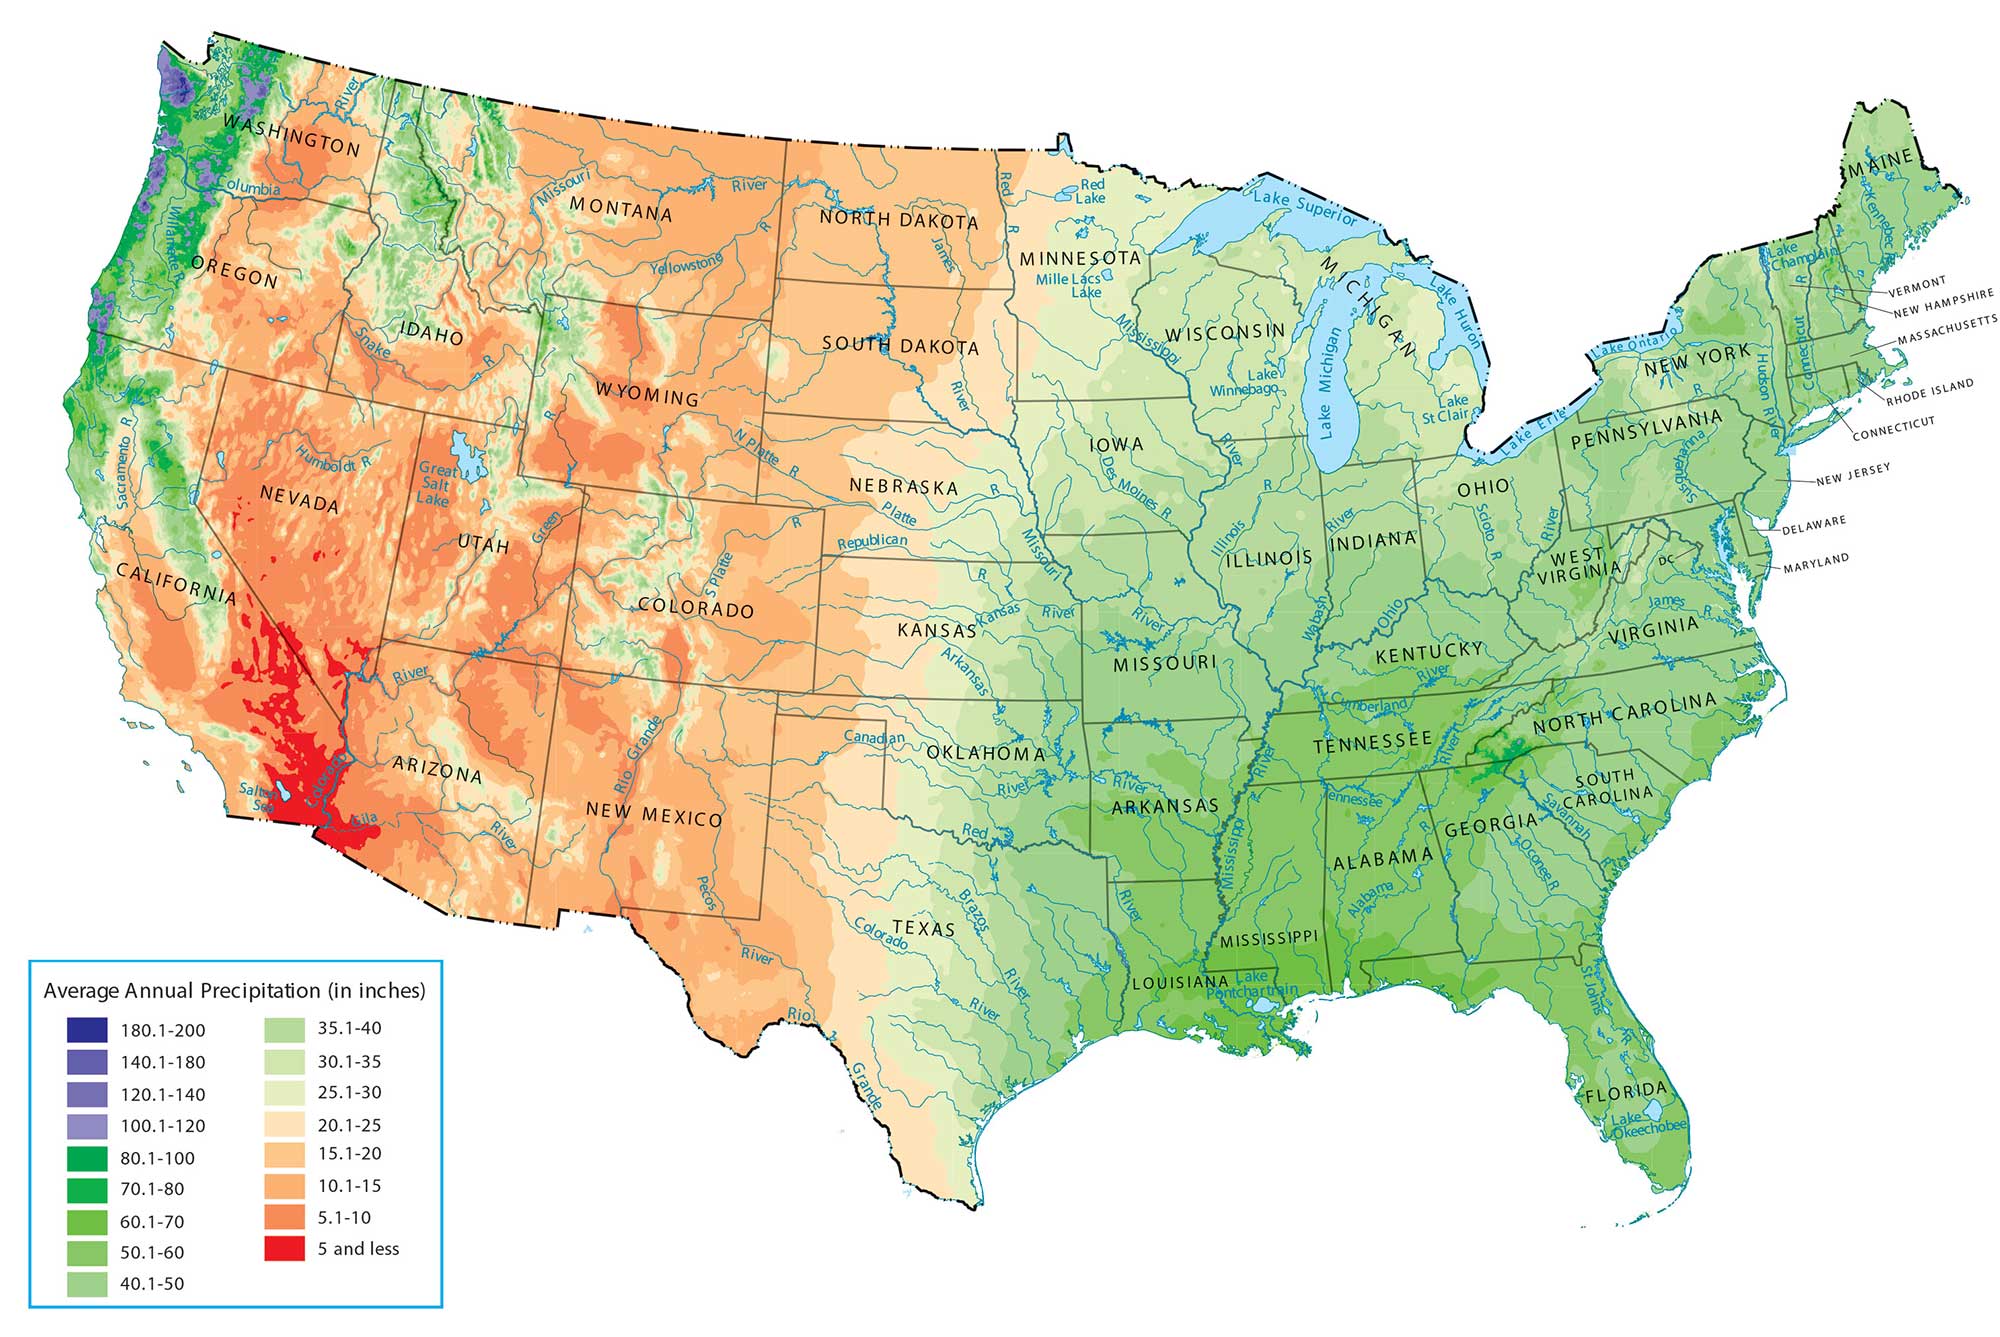
How much rain falls in the United States? Take a close look at this US precipitation map to see where it falls the most and least.
The first thing you’ll notice is that precipitation varies widely across the United States. If you look at somewhere like Death Valley in California, there is as little as 2.3 inches per year. But Mount Waialeale in Hawaii receives the most precipitation at a high of 460 inches!
At a state level, Nevada is the driest state with an average annual precipitation of 9.5 inches. But the islands of Hawaii are the wettest in the United States receiving as much as 70.3 inches of rainfall.
Data Source
The average annual precipitation data for this map layer were produced through the Natural Resources Conservation Service (NRCS) and the Spatial Climate Analysis Service at Oregon State University (OSU).
The PRISM Climate Mapping Project gathers climate observations from a wide range of monitoring networks. This US precipitation map shows polygons of average annual precipitation from 1961 through 1990.
Data from 1960-1990 over 35 years old. Where is an updated map the shows data over the full range of 1960-2024? Or at least a comparison map of 1990-2024. Too many people never check the underlying data relevance to maps they are using!!
Cali got it all, thats crazy
Hey can you point me to the underlying data set for rainfall please?
I updated the article. It’s PRISM climate data at Oregon State University.
How much rain falls in the United States.Take a close look at this US precipitation map to see where it falls the most and least.
The PRISM Climate Group gathers climate observations from a wide range of monitoring networks, applies sophisticated quality control measures,