Raster Analysis in GIS – Tools and Techniques
What is Raster Analysis?
Raster analysis is the process of analyzing spatial information contained in grid datasets. Each cell in a grid contains a value or class, which could be related to soils, land cover, elevation, or another type of data.
Using raster analysis, we can understand data about a place by looking at the pixel value. Unlike vector data, rasters contain pixels. Each pixel contains information about a particular geographic location.
Raster analysis involves analyzing and modeling geographic data using a grid.
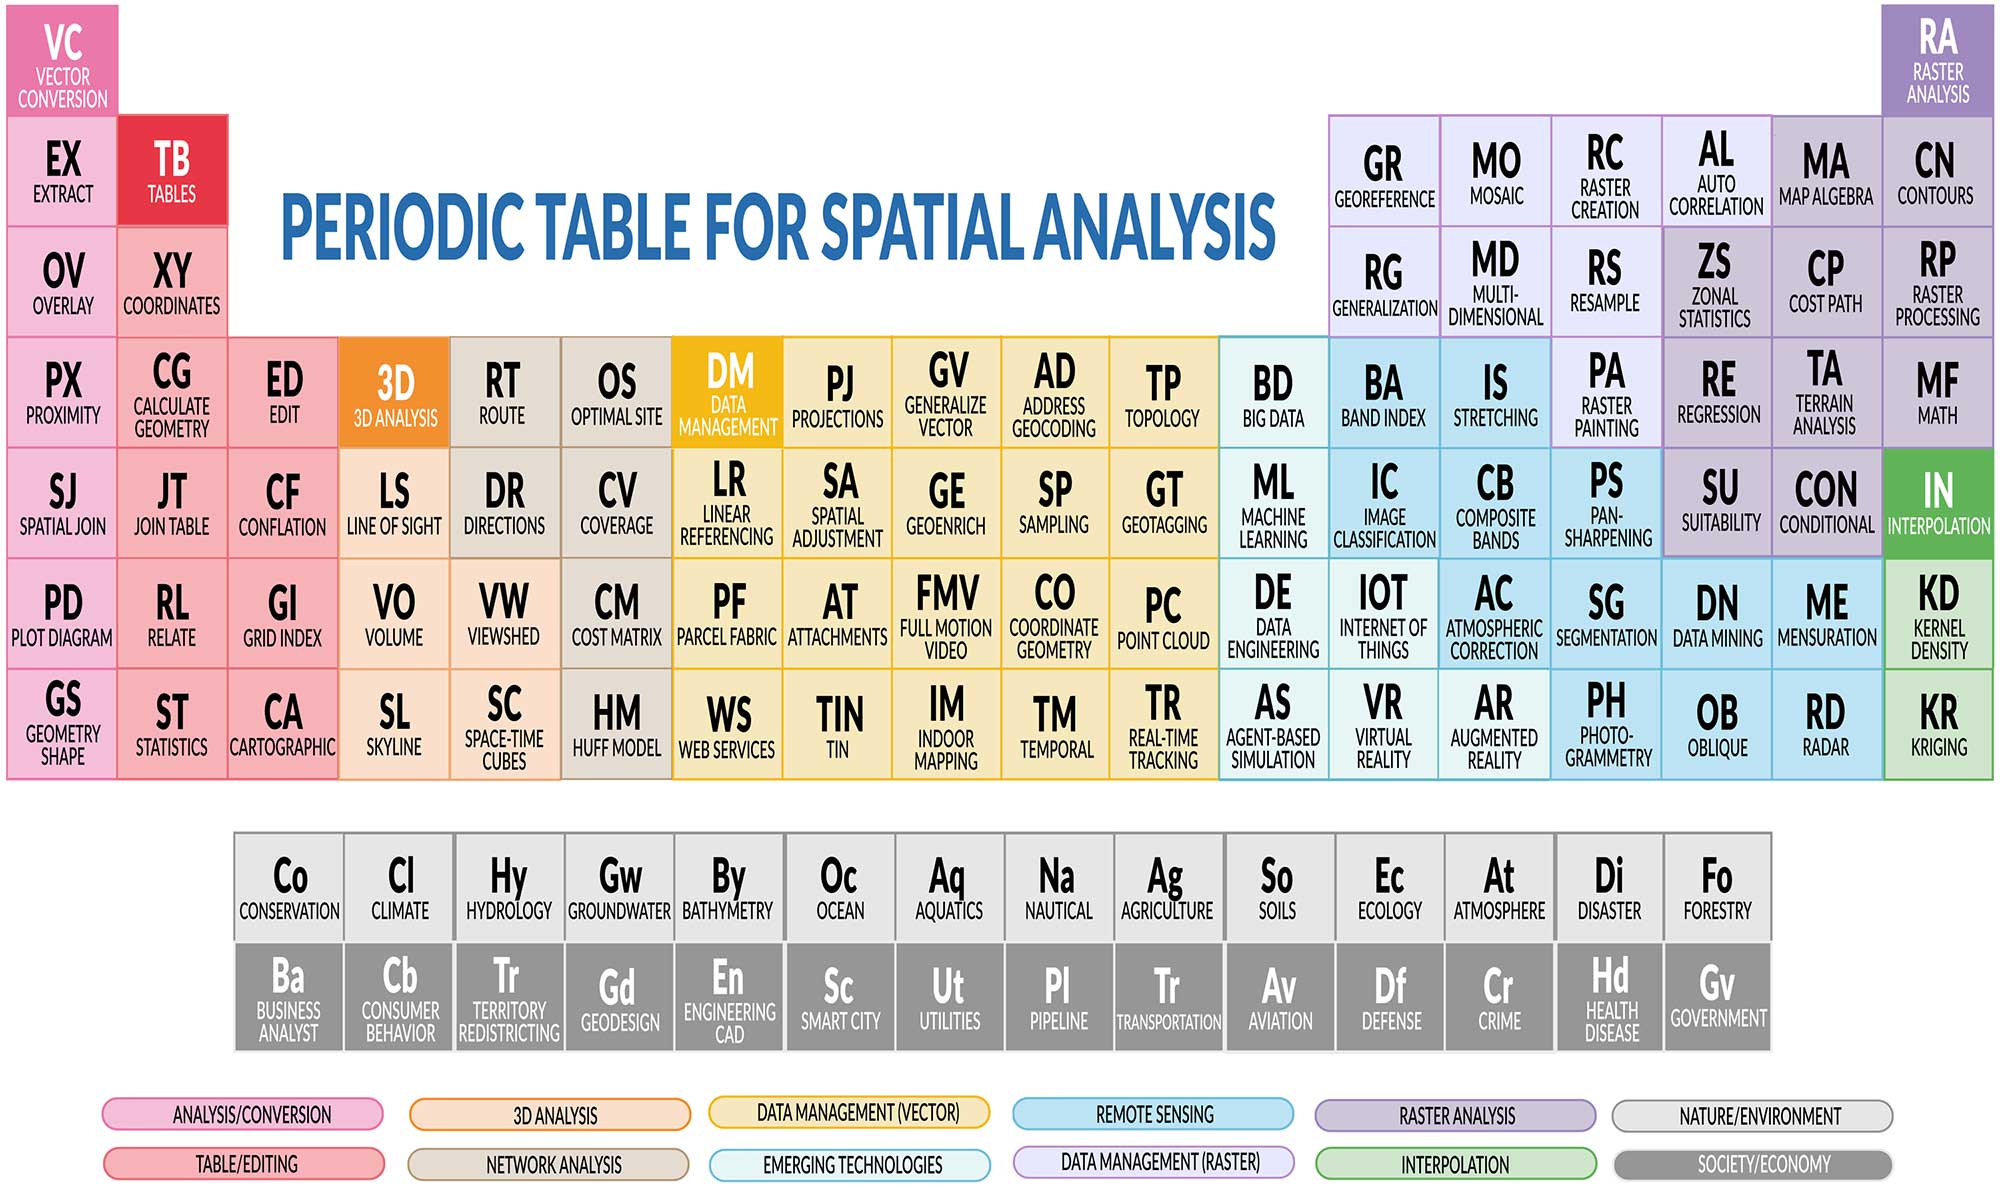
Before we get started, we’ve created a periodic table for spatial analysis, which classifies vector and table tools on the left. On the right, you can find the most common raster analysis tools in shades of purple, blue, and green. This article will go through these raster-based tools.
Raster Analysis Tools Techniques
There are several raster processing techniques you can use to analyze your data. Here are some of the most popular:
1. Map Algebra – Map algebra is a set of mathematical operations used to analyze raster data. For example, map algebra includes local, focal, zonal, and global operations.
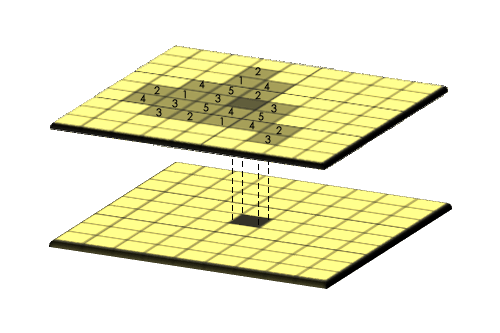
2. Zonal Statistics – This raster tool allows users to summarize information about one or more features within a zone. For instance, you calculate the mean, median, sum, minimum, maximum, and standard deviation of a set of values using zonal statistics.
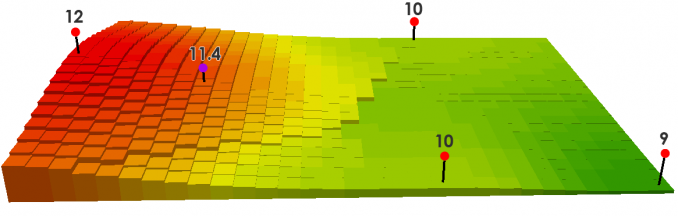
3. Contours – Contours are a representation of the shape and elevation of terrain features. GIS analysts generate contours by connecting points of equal elevation across a given area.
4. Math Functions – Math functions execute a type of numerical expression on a cell-by-cell basis. For instance, this may include arithmetic, power, exponential, and logarithmic types of functions.
5. Conditionals – A conditional function (or logical operator) is a raster operation that evaluates a set of conditions.
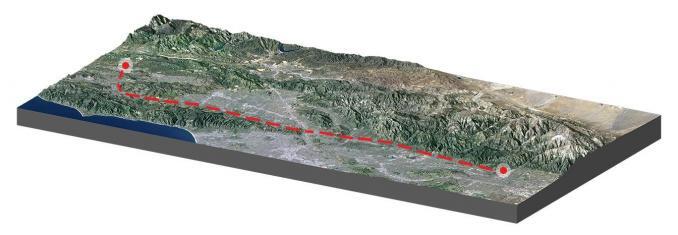
6. Cost Path – From a given source to a destination location, cost path analysis identifies the most cost-effective path.
7. Terrain Analysis – Terrain analysis is the process of using digital elevation data (DEM) to analyze various aspects of a landscape’s topography.
8. Suitability – A suitability analysis evaluates the potential of an area for a certain activity or purpose. This could include spatial regression models or other factors such as climate, soil type, and infrastructure.
9. Raster Processing – Raster processing is a “catch-all” term used to transform existing grid data into new outputs. Common raster processing tasks include selecting, clipping, and splitting raster datasets.
10. Interpolation – Interpolation techniques estimate unknown values based on existing sample points. The output of interpolation (such as IDW, kriging, or spline) is a raster surface.
If you’re looking for more examples of raster tools, here are more examples in the Raster Analysis Toolbox in ArcGIS Pro.
Selecting a Raster Data Type
Before you perform any type of raster processing, it is important to know the different data types you can use. The two main types of raster data are (1) continuous data and (2) discrete data.
Continuous Data – Continuous raster data refers to data that has a quantitative value. For instance, temperature, population, or imagery is continuous data.
Discrete Data – Discrete data refers to data that is qualitative and has values that are mutually exclusive. For example, it could be the presence or absence of a species or land cover.
When performing raster analysis, it is important to select the right data type. It is important to consider both the size of your data and the level of detail within it. This will help you decide which data type to use for raster processing.
Choosing the Right Raster Scale
When doing raster analysis, it’s important to use and create raster data at the right scale.
High Resolution – The smaller the grid size is, the more computing power and storage your raster analysis and data require.
Low Resolution – A larger grid size is smaller in file size. But if your grid size is too large, then you lose detail in your raster data.
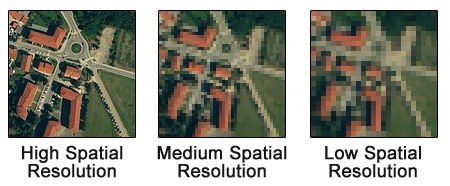
No matter which cell size you pick, it’s always important to consider the resolution of your input or output raster data.
Examples of Raster Analysis
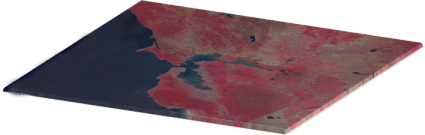
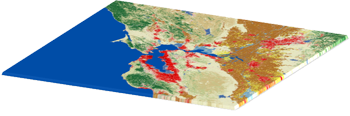
You’ll most often see raster analysis in remote sensing. Satellite imagery, digital elevation models, and land cover products are all examples of grid-based data. But it’s not limited to remote sensing as we often use raster data in disciplines such as geology, hydrology, and soil science.
For example, a hydrologist may use this type of analysis to calculate the slope and runoff in an area. Alternatively, an ecologist may use it to develop a habitat suitability model. A geologist may use raster data and analysis to create a soil map that shows the types of soil found in an area and how they are distributed.
There are thousands of GIS applications for spatial analysis. Raster analysis is helpful for projects that involve mapping and visualizing data in the environment and geospatial research. For example, if you are studying the changing temperatures in a specific area over time, you can use raster processing to create a map that shows this data.
Conclusion
Raster analysis uses gridded data for geospatial analysis. Although we most commonly associate it with remote sensing, we can use raster processing in a wide range of disciplines.
Raster analysis can identify trends and patterns in data or detect changes over time on a cell-by-cell basis. Overall, raster analysis is a helpful tool in GIS for analyzing large volumes of data quickly.


