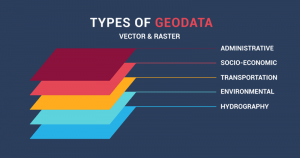
Vector vs Raster in GIS: What’s the Difference?
Spatial data observations focus on locations.
Every house, every tree, and every city has its own unique latitude and longitude coordinates.
The two primary types of spatial data are vector and raster data in a GIS. But what is the difference between raster and vector data?
When should we use raster and when should we use vector features? Find out more about the spatial data models commonly used.
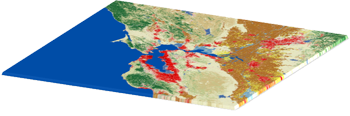
Vectors are points, lines, and polygons
Vector data is not made up of a grid of pixels. Instead, vector graphics are comprised of vertices and paths.
The three basic symbol types for vector data are points, lines, and polygons (areas).
Because cartographers use these symbols to represent real-world features in maps, they often have to decide based on the level of detail on the map.
Points are XY coordinates
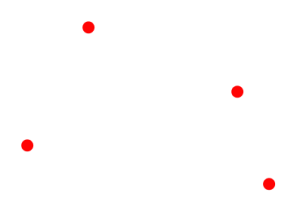
Vector points are simply XY coordinates. Generally, they are latitude and longitude with a spatial reference frame.
When features are too small to be represented as polygons, points are used.
For example, you can’t see city boundary lines on a global scale. In this case, maps often use points to display cities.
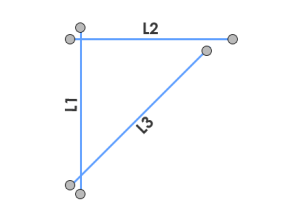
Lines connect vertices
Vector lines connect each vertex with paths. Basically, you’re connecting the dots in a set order and it becomes a vector line with each dot representing a vertex.
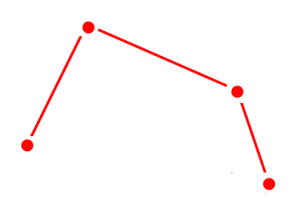
Lines usually represent features that are linear in nature. For example, maps show rivers, roads, and pipelines as vector lines. Often, busier highways have thicker lines than abandoned roads.
On the other hand, networks are line data sets but they are often considered to be different. This is because linear networks are topologically connected elements. They consist of junctions and turns with connectivity.
If you were to find an optimal route using a traffic line network, it would follow set rules. For example, it can restrict turns and movement on one-way streets.
Polygons connect vertices and close the path
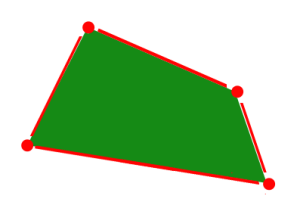
When you join a set of vertices in a particular order and close it, this is now a vector polygon feature. When you create a polygon, the first and last coordinate pairs are the same.
Cartographers use polygons to show boundaries and they all have an area. For example, a building footprint has square footage and agricultural fields have acreage.
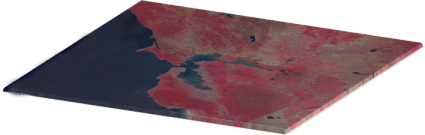
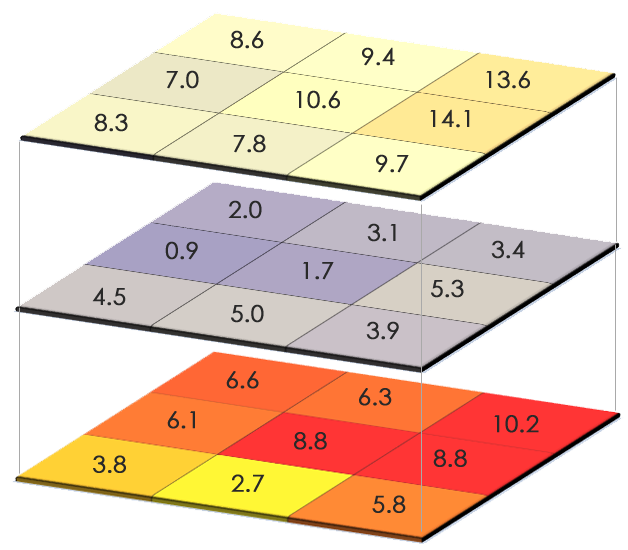
Raster Types: Discrete vs Continuous
Raster data is made up of pixels (also referred to as grid cells). They are usually regularly spaced and square but they don’t have to be. Rasters often look pixelated because each pixel has its own value or class.
For example:
Each pixel value in a satellite image has a red, green, and blue value. Alternatively, each value in an elevation map represents a specific height. It could represent anything from rainfall to land cover.
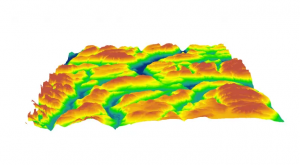
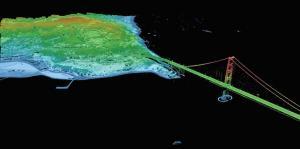
Raster models are useful for storing data that varies continuously. For example, elevation surfaces, temperature, and lead contamination.

Raster data models consist of 2 categories – discrete and continuous.
Discrete Rasters have distinct values
Discrete rasters have distinct themes or categories. For example, one grid cell represents a land cover class or a soil type.
In a discrete raster land cover/use map, you can distinguish each thematic class. Each class can be discretely defined where it begins and ends.
In other words, each land cover cell is definable and it fills the entire area of the cell.
Discrete data usually consists of integers to represent classes. For example, the value 1 might represent urban areas, the value 2 represents forest, and so on.
Continuous Rasters have a gradual change
Continuous rasters (non-discrete) are grid cells with gradually changing data such as elevation, temperature, or an aerial photograph.
A continuous raster surface can be derived from a fixed registration point. For example, digital elevation models use sea level as a registration point.
Each cell represents a value above or below sea level. As another example, aspect cell values have fixed directions such as north, east, south, or west.
Phenomena can gradually vary along a continuous raster from a specific source. A raster depicting an oil spill can show how the fluid moves from high concentration to low concentration. At the source of the oil spill, concentration is higher and diffuses outwards with diminishing values as a function of distance.
Vector data advantages and disadvantages
What are the advantages of using vector data?
Because vector data have vertices and paths, this means that the graphical output is generally more aesthetically pleasing. Furthermore, it gives higher geographic accuracy because data isn’t dependent on grid size.
Topology rules can help data integrity with vector data models. Not only that, network analysis and proximity operations use vector data structures.
What are the disadvantages of using vector data?
Continuous data is poorly stored and displayed as vectors. If you want to display continuous data as a vector, it would require substantial generalization. Although topology is useful for vector data, it is often processing intensive. Any feature edits require updates on topology. With a lot of features, vector manipulation algorithms are complex.
Did you know?
The spaghetti data model was one of the first conceptual models to add structure to features in a GIS.
It was a simple GIS model where lines may cross without intersecting or topology without attributes.
What are the advantages of raster data?
A raster grid format is a data model for satellite data and other remote sensing data. For raster positions, it’s simple to understand cell size.
Map algebra with raster data is usually quick and easy to perform. Overall, quantitative analysis is intuitive with discrete or continuous rasters.
What are the disadvantages of raster data?
Because cell size contributes to graphic quality, it can have a pixelated look and feel. To illustrate, linear features and paths are difficult to display.
You cannot create network datasets or perform topology rules on rasters. Also, you don’t have the flexibility with raster data attribute tables.
Raster datasets can become potentially very large because they record values for each cell in an image. As resolution increases, the size of the cell decreases. But this comes at a cost for speed of processing and data storage.
Vector vs Raster: Spatial Data Types
It’s not always straightforward which spatial data type you should use for your maps.
In the end, it really comes down to how the cartographer conceptualizes the feature on their map.
- Do you want to work with pixels or coordinates? Raster data works with pixels. Vector data consists of coordinates.
- What is your map scale? Vectors can scale objects up to the size of a billboard. But you don’t get that type of flexibility with raster data
- Do you have restrictions on file size? Raster file size can result in much larger (in comparison with vector data sets with the same phenomenon and area).
There are some of the features you have to think about during the data design and conceptualization phase.
Spatial data structures
Spatial data types provide the information that a computer requires to reconstruct the spatial data in digital form.
In the raster world, we have grid cells representing real-world features. In the vector world, we have points, lines, and polygons that consist of vertices and paths.
Vector and raster data both have their advantages and disadvantages.
But don’t sweat it:
Because you can convert vector to raster. And vice versa.
Do you have anything to add? Let me know with a comment below.


j’aimerais comprendre un peu plus sur le modèle spaghetti
What are some of the examples of discreet data?
Anything not continuous. Most common examples I can think of are:
1) Land cover
2) Soils classification
3) Forest types
How we change raster to vector and vice versa?
Thank you.
You’ll find it in the conversion tools. Feature to raster. Or raster to feature.
Nice to read this article hope to get more regarding GIS.
While I appreciate the information, its presentation is uneven and inconsistent. For example, the discussion (or lack thereof) regarding the pluses and minuses of each format. You, you touch on each, but I find the explanation lacking. That said, I found the piece useful.
This is so helpful, thank you
I m Msc GIS student I want the GIS material soft copy please help me.
Thank you so much for the info
This is part of my study in public health, would love to learn more.
Vector data expresses by point, line and area/polygon and has discrete values for features.
Whereas raster data is expressed by grid cell or pixel cell.
I love this. Great boxing match!
Also you have to written the applications in agriculture also. Please that it is helps many students.
Looking for Topo maps for CAP cadet training for ground team search and rescue in the North Carolina Area. I would like to have ability to download area maps free of charge.
Can you advise us if this option is available?
Have you tried the USGS topographic maps? https://gisgeography.com/download-usgs-topo-maps-free/
Kudos to this site, I guess everything here is well explained thus concise, thanks to the team GISGeography!
please what is the relationship between Geospatial features and digital data input in terms of representation and dissemination of Geoinformation
Thank you for the shared information; by the way, provide me with the spatial data collection techniques.
What are some sources/tools to create custom rasters? Please mention open source only.
Most open source GIS software allows you to create rasters like in this list – https://gisgeography.com/free-gis-software/
You’ll have to be more specific what you want to do for me to recommend any particular software package
Whether google maps are raster or vector????
This was exactly what I needed. Thank you for your time and expertise. This was explained very well.
Thank you very much for the valuable knowledge you shared.
How are spatial data designed and stored? Can we use UML and then store data in relational databases?
I have binary data that is either going to be represented by a 1 (0-15% slope) or 0 (>15% slope) slope. If publishing on a webmap, I am under the impression that raster would be a better format to use. Any thoughts?
I agree with the binary raster
Thanks for the post. I found myself on this website because I am trying to learn the advantages of both raster and vector. So even though I am not going to be building a map, this was really useful info to help me understand some of the uses and properties of both image types.
Thanks again.
How is a surface created that shows the distance from a particular point in all directions in the vector and raster data models
Thank you
Generally vectors can be more complex, and don’t have the chessboard appearance like rasters… So I’d lean towards vector to represent reality better
Which represents the real world most accurately