Spatial Patterns in Geography and GIS
Spatial patterns show how things are connected on Earth. These patterns can be natural or human-made. When we use GIS, we can see where things are and how they relate. Today, let’s focus on spatial patterns in the world of geography and GIS.
Types of Point Distributions
Point distribution is the way specific locations are mapped as individual points on a map. These points can represent anything. For example, they can show the location of trees in a forest. Or they could be addresses of houses in a city.
By analyzing point distribution, we can identify spatial patterns. For example, we can cluster points or generate heat maps. More on this later. First, let’s discuss the types of point distributions.
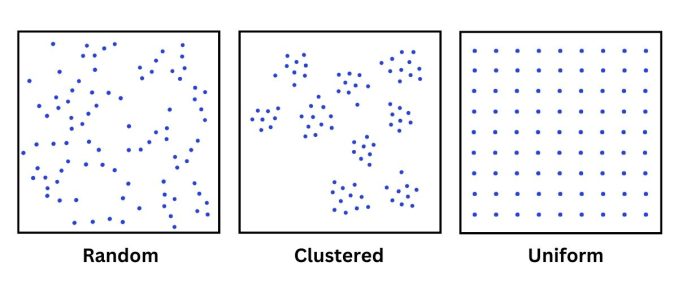
Random Distribution
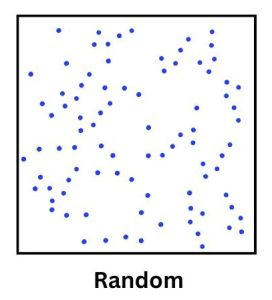
A random point distribution occurs when points are scattered across an area without any predictable pattern. This means the points don’t show any clear clustering or regular spacing between them.
For example, meteorite landing sites on Earth could show a random distribution. As they strike, locations are independent of each other. I wonder about UFO sightings though.
Clustered Distribution
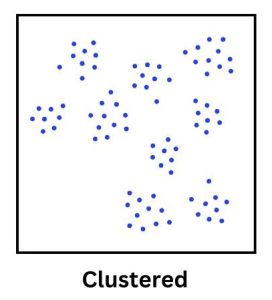
A clustered point distribution is when points are grouped in certain areas. This pattern suggests that the points share similar factors, causing them to gather. These high-concentration areas can also indicate an area of high activity or interest.
For example, houses built around a popular lake might form a clustered distribution, showing how people prefer to live near water. Another example is earthquake locations along tectonic plate boundaries.
Uniform Distribution
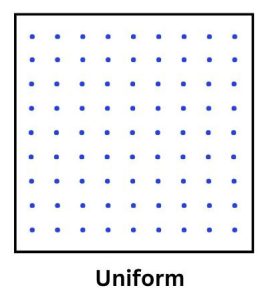
Uniform point distribution occurs when points are evenly spaced across an area. They typically show a consistent pattern of distribution. It often indicates a deliberate arrangement that results in regular spacing.
For example, trees in a woodlot planted at equal distances are a display of uniform point distribution. Similarly, another example is street lights along a highway at regular-spaced intervals. Both demonstrate deliberate uniform spacing in geography.
Finding Spatial Patterns
We use geoprocessing and data visualization to identify spatial patterns. Each one can help discover distributions and relationships in data across geographic areas.
Moran’s I
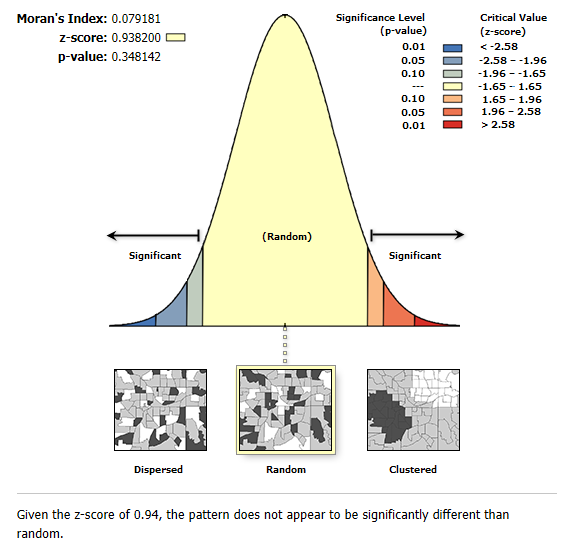
Moran’s I provides a numerical measure of clustering from -1 to 1. Specifically, it’s a statistic we use to measure spatial autocorrelation.
We use Moran’s I to discern whether similar or dissimilar values cluster together in a map. It helps in understanding if features are randomly distributed or clustered together.
Heat Maps
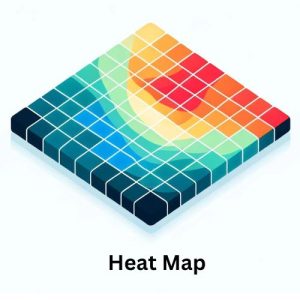
Heat maps use color to show density or magnitude. This makes it easy to spot areas of high concentration. For example, they are great for showing crime rates or population density.
Because of this, we can quickly identify problem areas or regions in need of services. So, heat maps are a unique tool for visualizing spatial patterns.
Cartograms
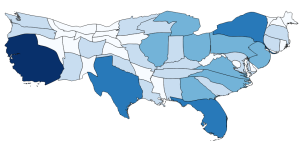
Cartograms distort the shape and size of geographic areas to represent a particular data variable. For example, a high population value will enlarge the size of a polygon.
Cartograms come in different styles. For example, there are density-equalizing, Dorling, and non-contiguous cartograms. No matter the type, the size of the area changes to reflect the value of the data it represents.
Clustering
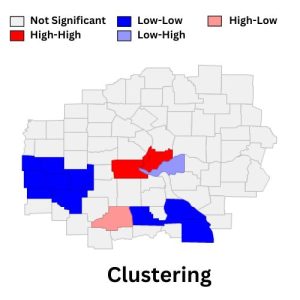
Point clustering groups data points on a map that are close to each other based on their location. It indicates areas with a high concentration of any feature.
So, by spotting these point clusters, we can understand where features are concentrated. While this helps identify patterns in spatial data, it also guides better decision-making.
Geographic Regression
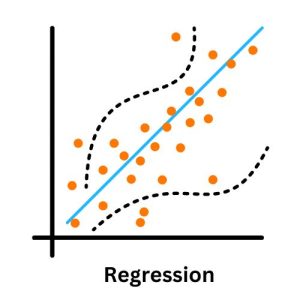
Geographically Weighted Regression (GWR) takes into account the geographic location of data points to model variable relationships. For example, GWR might model how deer prefer specific habitats.
Traditional regression models assume that the relationship between dependent and independent variables is the same everywhere. But this isn’t always true in real-world scenarios. Spatial patterns emerge because different factors can influence outcomes in different ways depending on their location.
Types of Spatial Patterns
For the most part, we’ve discussed point distributions. What about other types of spatial data like lines and polygons? Here are some spatial relationships we can find in these types of data.
Proximity
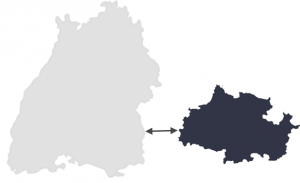
Finally, proximity is being close enough that you can establish contact without physical contact with each other.
For example, two schools located within a mile of each other are in proximity. They’re close enough to collaborate on events without being next door.
Adjacency
Adjacency is when two polygon entities are directly connected sharing a boundary. Think about two neighboring states sharing a border. For example, Arizona and Nevada touch along their state lines and are adjacent. See our map of USA for an example of adjacency.
Overlap
An overlap occurs when a single entity shares the same location or partial location of another entity. This means two or more features are on top of each other in the same space.
For example, a park might overlap with a city boundary, being both inside and outside the city.
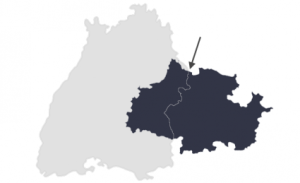
Contiguity
Contiguity is the relationship between two or more entities when they share an edge. We find this spatial relationship when areas are next to each other, sharing a side. For example, the 48 contiguous U.S. states all touch at least one other state’s border, as shown in our United States map.
READ MORE: How Spatial Join Works in GIS
Spatial Patterns in Geography and GIS
Spatial patterns show us how things are connected in the world. With GIS technology, we can visualize and analyze spatial patterns.
Are there any types of spatial patterns that we missed? Please let us know in the comment section below.


